Your ML models are behaving exactly as expected. Accuracy is up. CI/CD pipelines are green. Retraining runs on schedule. Then you ship an LLM-powered feature, and suddenly the metrics you trusted for years tell you nothing useful.
A user complains that the assistant gave confidently wrong advice. Your dashboards show zero errors. Latency looks fine. Token usage is within budget. But the output was silently broken in a way your existing observability stack could not see.
This is the operational gap that LLMOps exists to close. And it starts by understanding why the practices that work well for traditional ML models fall short the moment you introduce a large language model into production.
The Problem With Applying MLOps to LLMs
MLOps is a mature discipline. It gives teams structured workflows for data versioning, model training, deployment automation, drift detection, and retraining pipelines. It works well when the system produces deterministic or near-deterministic outputs from structured inputs.
LLMs break nearly every assumption behind that model.
A traditional ML classifier takes a fixed set of features and returns a score. You can measure that score against a ground truth. You can detect when that score drifts over time. You can retrain on new labeled data and verify improvement with standard metrics like accuracy, F1, and AUC.
An LLM takes free-form text, follows a chain of reasoning influenced by a prompt written by a developer, retrieves context from a vector store, calls external tools, and generates a paragraph of natural language. The output is non-deterministic. Two identical inputs can return different outputs on different runs. There is no single ground truth to compare against. And the failure modes are qualitative, not numerical.
According to Gartner, over 50% of generative AI deployments in enterprises are expected to fail. The primary reasons include hallucinated outputs caused by poor grounding, unprepared enterprise data architectures, and the lack of structured workflows for prompt-driven systems. These are not MLOps problems. They require a different operational framework entirely.
What Actually Changes With LLMs in Production
The differences between MLOps and LLMOps are not cosmetic. They reflect genuinely different system architectures, failure modes, cost structures, and feedback loops. Here is where the gap is widest.
1. Prompts Are Live Code
In MLOps, the unit of change is a model weight or a dataset. Changes go through training pipelines, validation, and staged rollout. In LLMOps, a prompt change can silently alter system behavior in production within seconds, with no retraining required and no model version bump. A developer editing a system prompt at 3pm on a Friday is making a production change with potentially wide impact. Without prompt versioning and change tracking, you have no way to correlate a degradation in output quality with the prompt edit that caused it.
2. Failure Is Semantic, Not Numerical
Traditional monitoring flags errors when a value crosses a threshold. A latency spike, a memory overflow, a 500 response code. These are binary signals. LLM failures are qualitative. The model returns a valid HTTP 200 with a well-formed JSON response, and the answer is factually wrong, off-topic, or harmful. Your infrastructure sees a successful request. The user sees a broken product. This is what practitioners call a silent failure, and it is one of the hardest problems in operating LLM systems.
3. The Cost Model Is Inverted
MLOps cost is dominated by training compute. You run an expensive training job, deploy the result, and inference is relatively cheap. In LLMOps, training is often skipped entirely because you are calling a foundation model via API. Every inference call costs money based on token count. A verbose system prompt, an inefficient RAG retrieval pipeline, or an agent that loops unnecessarily can inflate costs by an order of magnitude with no visible signal in your infrastructure metrics. Cost governance has to be built into the observability layer itself.
4. The Context Window Is State
A traditional ML model is stateless. Each prediction is independent. An LLM pipeline carries state through the context window. Retrieved documents, conversation history, tool call results, and intermediate reasoning all accumulate inside a single request. When an output is wrong, the cause may be anywhere in that context chain. Debugging requires tracing every component that contributed to what the model saw, not just the final model call.
5. The Feedback Loop Is Broken by Default
MLOps has a clear retraining signal: new labeled data, measured performance degradation, updated model. LLMOps does not have a clean equivalent. User feedback is sparse, delayed, and noisy. Automated evaluation requires LLM-as-judge patterns that introduce their own reliability questions. Prompt changes that improve one failure mode can degrade another. The feedback loop has to be architected deliberately, because it does not emerge naturally from the infrastructure.
The Five Pillars of LLM Observability
Before we look at the architecture, it helps to name what LLMOps observability actually covers. These five pillars form the foundation of every topic in this series.
The first pillar is distributed tracing. Every step in an LLM pipeline, from the incoming user message through retrieval, embedding, model calls, tool executions, and final response generation, needs to be captured as a traceable span. This gives you a complete picture of how an output was produced and where time or quality was lost.
The second pillar is output evaluation. Continuous assessment of response quality across dimensions including relevance, factual accuracy, faithfulness to retrieved context, and safety. This includes automated metrics, model-based evaluation, and human feedback integration.
The third pillar is prompt management. Versioning, change tracking, A/B testing, and rollback for prompts treated as first-class production artifacts rather than informal strings in source code.
The fourth pillar is cost and performance monitoring. Token-level usage tracking, latency measurement including time-to-first-token, cost attribution by model, environment, team, or agent, and budget enforcement with alerting.
The fifth pillar is model and RAG lifecycle management. Tracking model versions, embedding model changes, retrieval pipeline configurations, and the relationships between all of these components and observed output quality over time.
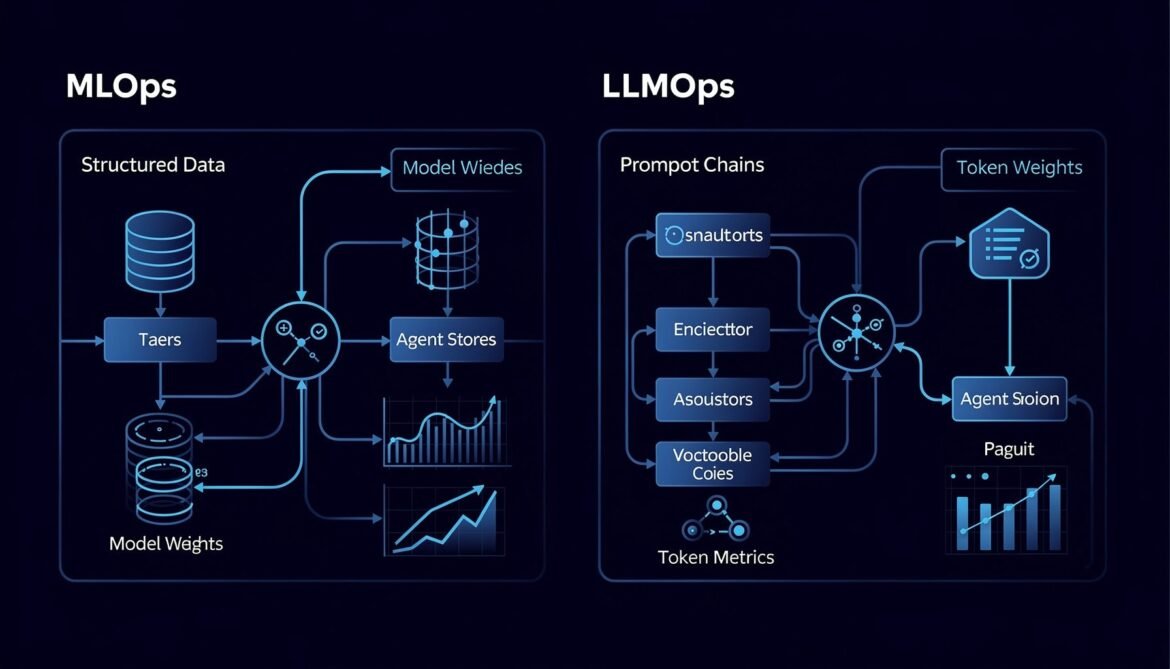
LLMOps vs MLOps: A Direct Comparison
The table below summarizes how the two disciplines differ across the key operational dimensions you need to manage in any AI system.
| Dimension | MLOps | LLMOps |
|---|---|---|
| Primary artifact | Model weights, datasets | Prompts, embeddings, retrieval config |
| Failure mode | Numerical drift, accuracy drop | Semantic failure, hallucination, toxicity |
| Monitoring signal | Accuracy, F1, latency, error rate | Relevance, faithfulness, token cost, trace depth |
| Cost driver | Training compute | Inference tokens per request |
| Change unit | Model version, dataset version | Prompt version, retrieval pipeline, model swap |
| State management | Stateless predictions | Context window as accumulated state |
| Feedback loop | Labeled data, retraining schedule | Human feedback, LLM-as-judge, online evaluation |
| Tooling | MLflow, Kubeflow, SageMaker | Langfuse, LangSmith, Arize, W&B Weave |
The LLMOps Operational Stack
The diagram below shows how the LLMOps stack is layered, from infrastructure through to the feedback loops that drive continuous improvement.
flowchart TD
    A[User Request] --> B[API Gateway / AI Gateway]
    B --> C[Prompt Management Layer]
    C --> D[LLM Orchestration\nLangChain / Semantic Kernel]
    D --> E[Retrieval Layer\nVector DB / RAG Pipeline]
    D --> F[LLM Provider\nAzure OpenAI / Anthropic]
    D --> G[Tool Execution\nMCP / Function Calls]
    E --> F
    G --> F
    F --> H[Response Post-Processing\nGuardrails / Output Validation]
    H --> I[Final Response to User]

    B --> J[Observability Layer]
    C --> J
    D --> J
    E --> J
    F --> J
    G --> J
    H --> J

    J --> K[Tracing\nOpenTelemetry]
    J --> L[Metrics\nToken Cost / Latency]
    J --> M[Evaluation\nQuality Scoring]

    K --> N[Observability Backend\nLangfuse / Arize / LangSmith]
    L --> N
    M --> N

    N --> O[Dashboards\nGrafana / Built-in UI]
    N --> P[Alerts and Budgets]
    N --> Q[Feedback Loop\nPrompt Tuning / Model Swap]

    Q --> C
    Q --> D
    Q --> E

    style J fill:#1e3a5f,color:#ffffff
    style N fill:#1e3a5f,color:#ffffff
    style Q fill:#2d5016,color:#ffffff
Where Traditional Observability Falls Short
Most engineering teams start with the observability tools they already know: Datadog, Prometheus, Grafana, and application performance monitoring from their cloud provider. These tools are excellent at what they were built for. They tell you whether your system is running. They do not tell you whether your AI system is behaving correctly.
Consider what happens when a RAG pipeline returns the wrong documents for a user query. The retrieval call completes successfully. The embedding lookup returns in 40 milliseconds. The LLM generates a fluent, confident paragraph. Every infrastructure metric is green. The user received an answer grounded in the wrong context and will never know it. Your traditional monitoring stack has no signal for this event.
LLM-native observability fills this gap by capturing semantic meaning alongside technical telemetry. It records what the user asked, what documents were retrieved, how the model interpreted that context, and whether the final output was faithful to the retrieved information. This richer signal is what makes it possible to debug failures that traditional monitoring cannot see.
What This Series Covers
This is Part 1 of an 8-part series on building production-grade AI observability and LLMOps infrastructure. Each part builds on the previous one and ends with working code you can deploy in your own environment.
- Part 1 (this post): Why LLMOps is not MLOps — the new operational reality
- Part 2: Distributed tracing for LLM applications with OpenTelemetry
- Part 3: LLM metrics that actually matter — latency, cost, hallucination rate, and drift
- Part 4: Evaluating LLM output quality in production — LLM-as-judge and human feedback loops
- Part 5: Prompt management and versioning — treating prompts as production code
- Part 6: RAG pipeline observability — tracing retrieval, chunking, and embedding quality
- Part 7: Cost governance and FinOps for LLM workloads
- Part 8: Building a complete LLMOps stack — from zero to production-grade observability
In Part 2, we will instrument an LLM application from scratch using OpenTelemetry, capturing spans across every layer of the pipeline in Node.js, Python, and C#.
Key Takeaways
- MLOps and LLMOps share foundational principles but diverge fundamentally in failure modes, cost structure, and feedback loops
- LLM failures are semantic and silent — traditional monitoring cannot detect them
- Prompts must be treated as versioned production artifacts, not informal configuration
- The context window is state, and tracing that state across an entire pipeline is the foundation of LLM observability
- Inference token cost must be a first-class operational metric alongside latency and error rate
References
- TrueFoundry – “LLMOps vs MLOps: Key Differences” (https://www.truefoundry.com/blog/llmops-vs-mlops)
- N-iX – “LLMOps vs MLOps: Key differences, use cases, and success stories” (https://www.n-ix.com/llmops-vs-mlops/)
- ZenML – “MLOps vs LLMOps: What’s the Difference?” (https://www.zenml.io/blog/mlops-vs-llmops)
- OneReach.ai – “LLMOps for AI Agents: Monitoring, Testing and Iteration in Production” (https://onereach.ai/blog/llmops-for-ai-agents-in-production/)
- TrueFoundry – “10 Best AI Observability Platforms for LLMs in 2026” (https://www.truefoundry.com/blog/best-ai-observability-platforms-for-llms-in-2026)
- Medium – “The Complete MLOps/LLMOps Roadmap for 2026” (https://medium.com/@sanjeebmeister)