- Why Building a URL Shortener Taught Me Everything About Cloud Architecture
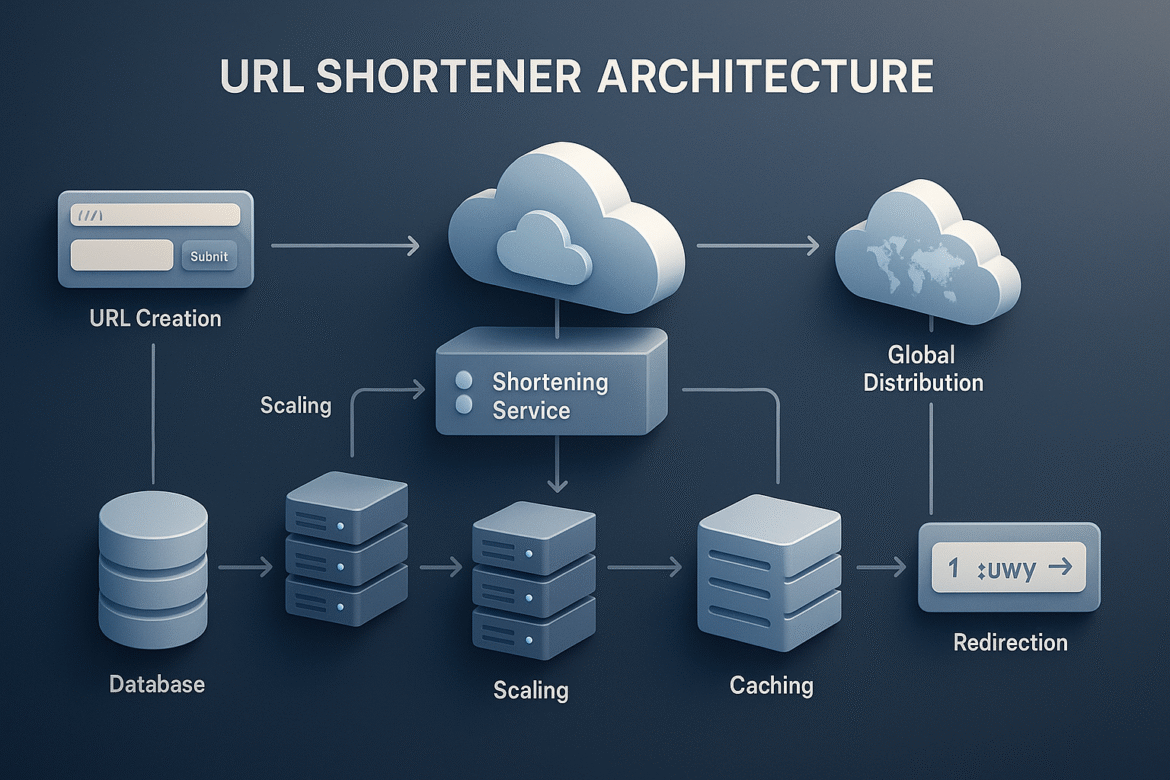
- From Napkin Sketch to Azure Blueprint: Designing Your URL Shortener’s Foundation
- From Architecture to Implementation: Building the Engine of Scale
- Analytics at Scale: Turning Millions of Click Events Into Intelligence
- Security and Compliance at Scale: Building Fortress-Grade Protection Without Sacrificing Performance
- Performance Optimization and Cost Management: Engineering Excellence at Sustainable Economics
- Monitoring, Observability, and Operational Excellence: Building Systems That Tell Their Own Story
- Deployment, DevOps, and Continuous Integration: Delivering Excellence at Scale
Part 7 of the “Building a Scalable URL Shortener on Azure” series
In our previous post, we explored the critical balance between performance optimization and cost management, demonstrating how these seemingly opposing forces actually reinforce each other when properly architected. We built intelligent systems that automatically optimize resource utilization while maintaining exceptional user experiences at sustainable costs.
Now we turn to one of the most crucial yet often overlooked aspects of production systems: building comprehensive observability that transforms your application from a black box into a transparent, self-diagnosing system. This capability becomes absolutely essential at scale, where traditional debugging approaches fail and the complexity of distributed systems makes it impossible to understand system behavior without sophisticated monitoring.
Today, we’re going to explore how observability is far more than collecting metrics and logs – it’s about building systems that can tell their own story, explain their behavior, and provide the insights needed for proactive management rather than reactive firefighting. Think of this as giving your system a sophisticated nervous system that can sense, interpret, and communicate its health status continuously.
The techniques we’ll develop apply to any complex system where understanding internal behavior is crucial for reliable operation. The observability patterns we’ll implement power everything from financial trading systems to social media platforms to critical infrastructure, providing the foundation for operational excellence that scales with system complexity.
Understanding effective observability requires shifting from thinking about monitoring as an external process to viewing it as an integral part of system architecture. The most effective observability solutions are deeply embedded in the application design, providing rich context that makes troubleshooting and optimization intuitive rather than forensic detective work.
The Observability Paradigm: From Reactive Monitoring to Proactive Intelligence
Before diving into Azure’s monitoring ecosystem and implementation strategies, we need to understand why observability at scale requires fundamentally different approaches than traditional monitoring. The key insight that transforms how you approach system visibility is recognizing the difference between monitoring (knowing when something is wrong) and observability (understanding why something is wrong and what to do about it).
Traditional monitoring approaches focus on predefined metrics and threshold-based alerting. These work well for simple systems with known failure modes, but become inadequate when dealing with complex distributed systems that exhibit emergent behaviors and novel failure patterns. At our scale, we need systems that can detect unknown unknowns and provide the context needed to understand complex system interactions.
The evolution from monitoring to observability reflects a fundamental shift in how we think about system complexity. Instead of trying to anticipate every possible failure mode and create alerts for each one, we instrument our systems to capture rich contextual information that enables investigation of any behavior, whether expected or unexpected.
Consider what happens when our URL shortener experiences a subtle performance degradation that affects only 2% of requests. Traditional monitoring might miss this entirely if it doesn’t exceed alert thresholds. Our observability approach will detect the degradation, correlate it with other system changes, identify the root cause, and potentially even suggest remediation steps automatically.
Understanding this paradigm shift requires examining three key observability pillars: metrics (what is happening), logs (what happened), and traces (how operations flow through the system). The power emerges when these three perspectives combine to provide comprehensive understanding of system behavior, enabling rapid troubleshooting and proactive optimization.
The sophistication lies in designing observability that scales with system complexity rather than being overwhelmed by it. As our system grows and becomes more complex, our observability must become more intelligent about filtering signal from noise, correlating related events, and providing insights that remain actionable despite the increased complexity.
Azure Monitor: Building a Comprehensive Observability Foundation
Azure Monitor provides a unified observability platform that integrates metrics, logs, and application insights into a coherent system for understanding complex distributed applications. The elegance of Azure Monitor lies not just in its data collection capabilities, but in its ability to correlate information across different types of telemetry to provide holistic insights.
Understanding how to leverage Azure Monitor effectively requires thinking about observability as a layered architecture where each layer provides different perspectives on system behavior. Application Insights reveals application-level performance and user experience. Azure Monitor Logs capture detailed operational data. Azure Monitor Metrics provide real-time performance indicators. When properly orchestrated, these layers create a comprehensive view of system health and behavior.
The foundation of our observability strategy rests on comprehensive instrumentation that captures not just system metrics but business metrics, user experience data, and operational context. This rich data foundation enables sophisticated analysis that can detect subtle issues, predict potential problems, and provide actionable insights for optimization.
/// <summary>
/// Comprehensive observability service that provides unified monitoring across all system components
/// This implementation demonstrates how to build rich observability that scales with system complexity
/// </summary>
public class ComprehensiveObservabilityService : IObservabilityService
{
    private readonly TelemetryClient _applicationInsights;
    private readonly ILogger<ComprehensiveObservabilityService> _logger;
    private readonly IMonitoringConfiguration _config;
    private readonly IMetricsCollector _metricsCollector;
    private readonly IDistributedTracing _distributedTracing;
    private readonly IBusinessMetricsCollector _businessMetrics;

    // Advanced correlation and analysis engines
    private readonly CorrelationEngine _correlationEngine;
    private readonly AnomalyDetectionEngine _anomalyDetection;
    private readonly PerformanceAnalyzer _performanceAnalyzer;

    // Real-time dashboards and alerting
    private readonly IDashboardService _dashboardService;
    private readonly IAlertingService _alertingService;

    public ComprehensiveObservabilityService(
        TelemetryClient applicationInsights,
        ILogger<ComprehensiveObservabilityService> logger,
        IMonitoringConfiguration config,
        IMetricsCollector metricsCollector,
        IDistributedTracing distributedTracing,
        IBusinessMetricsCollector businessMetrics,
        IDashboardService dashboardService,
        IAlertingService alertingService)
    {
        _applicationInsights = applicationInsights;
        _logger = logger;
        _config = config;
        _metricsCollector = metricsCollector;
        _distributedTracing = distributedTracing;
        _businessMetrics = businessMetrics;
        _dashboardService = dashboardService;
        _alertingService = alertingService;

        _correlationEngine = new CorrelationEngine(config.CorrelationSettings);
        _anomalyDetection = new AnomalyDetectionEngine(config.AnomalyDetectionSettings);
        _performanceAnalyzer = new PerformanceAnalyzer(config.PerformanceAnalysisSettings);
    }

    /// <summary>
    /// Captures comprehensive telemetry for a URL shortening operation
    /// This method demonstrates how to instrument operations for maximum observability
    /// </summary>
    public async Task<ObservabilityContext> TrackUrlShorteningAsync(
        string originalUrl,
        string shortCode,
        UrlShorteningContext context)
    {
        var operationId = Guid.NewGuid().ToString();
        var startTime = DateTimeOffset.UtcNow;

        // Create distributed tracing context
        using var activity = _distributedTracing.StartActivity("UrlShortening", operationId);
        activity.SetTag("url.original", originalUrl);
        activity.SetTag("url.shortCode", shortCode);
        activity.SetTag("user.id", context.UserId);
        activity.SetTag("user.ipAddress", context.IpAddress);
        activity.SetTag("request.userAgent", context.UserAgent);

        var observabilityContext = new ObservabilityContext
        {
            OperationId = operationId,
            CorrelationId = context.CorrelationId,
            StartTime = startTime,
            OperationType = "UrlShortening",
            Context = context
        };

        try
        {
            // Track business metrics
            await _businessMetrics.TrackUrlCreationAttemptAsync(context.UserId, context.IpAddress);

            // Track technical metrics
            _metricsCollector.IncrementCounter("url_shortening_requests_total", new Dictionary<string, string>
            {
                ["user_type"] = context.UserType.ToString(),
                ["source_application"] = context.SourceApplication,
                ["geographic_region"] = context.GeographicRegion
            });

            // Capture detailed application insights
            var telemetryProperties = new Dictionary<string, string>
            {
                ["OperationId"] = operationId,
                ["OriginalUrlDomain"] = ExtractDomain(originalUrl),
                ["UrlLength"] = originalUrl.Length.ToString(),
                ["UserType"] = context.UserType.ToString(),
                ["SourceApplication"] = context.SourceApplication,
                ["GeographicRegion"] = context.GeographicRegion,
                ["RequestPath"] = context.RequestPath,
                ["ReferrerDomain"] = ExtractDomain(context.Referer)
            };

            _applicationInsights.TrackEvent("UrlShorteningStarted", telemetryProperties);

            observabilityContext.Properties = telemetryProperties;
            return observabilityContext;
        }
        catch (Exception ex)
        {
            // Ensure observability failures don't impact core functionality
            _logger.LogWarning(ex, "Failed to initialize observability context for operation {OperationId}", operationId);
            return observabilityContext;
        }
    }
This comprehensive observability implementation demonstrates how to build systems that provide rich, actionable insights into their own behavior. The key insight here is that effective observability requires instrumentation that captures not just technical metrics but business context, user experience data, and performance correlations that enable rapid troubleshooting and proactive optimization.
Intelligent Alerting: From Noise to Signal
Building effective alerting systems at scale requires sophisticated approaches that can distinguish between symptoms that require immediate attention and normal system variations that are part of healthy operation. The challenge lies in creating alerting systems that have high signal-to-noise ratios, providing actionable alerts that enable rapid response without overwhelming operations teams with false positives.
Understanding intelligent alerting requires thinking about alerts as part of a broader incident response ecosystem rather than isolated notifications. The most effective alerts provide not just notification of a problem but context about the problem’s severity, likely causes, and recommended response actions. This transforms alerts from simple notifications into actionable intelligence that enables rapid problem resolution.
Our intelligent alerting approach combines multiple techniques: baseline-based alerting that understands normal system behavior, correlation-based alerting that considers relationships between different metrics, and predictive alerting that can warn about potential issues before they impact users. This multi-dimensional approach enables us to catch both obvious problems and subtle degradations that might otherwise go unnoticed.
/// <summary>
/// Generates specific actions for response time alerts based on system context
/// This method provides targeted recommendations for performance issues
/// </summary>
private async Task<List<RecommendedAction>> GenerateResponseTimeActionsAsync(
    MetricAlert alert,
    MetricContext context,
    CorrelationAnalysis correlationAnalysis)
{
    var actions = new List<RecommendedAction>();

    // Check cache performance correlation
    var cacheMetrics = correlationAnalysis.CorrelatedMetrics
        .FirstOrDefault(m => m.MetricName.Contains("cache"));

    if (cacheMetrics != null && cacheMetrics.IsAnomalous)
    {
        actions.Add(new RecommendedAction
        {
            Title = "Investigate Cache Performance",
            Description = "Cache hit rate has decreased, likely causing increased response times",
            Priority = ActionPriority.High,
            ExpectedEffectiveness = 0.8,
            EstimatedTimeToImplement = TimeSpan.FromMinutes(10),
            Steps = new[]
            {
                "Check cache server health and connectivity",
                "Review cache eviction patterns for unusual activity",
                "Consider cache warming for frequently accessed URLs",
                "Verify cache configuration and capacity limits"
            },
            AutomationAvailable = true,
            AutomationScript = "Scripts/InvestigateCachePerformance.ps1"
        });
    }

    // Check database performance correlation
    var databaseMetrics = correlationAnalysis.CorrelatedMetrics
        .FirstOrDefault(m => m.MetricName.Contains("database"));

    if (databaseMetrics != null && databaseMetrics.IsAnomalous)
    {
        actions.Add(new RecommendedAction
        {
            Title = "Analyze Database Performance",
            Description = "Database metrics show anomalies that may be causing response time issues",
            Priority = ActionPriority.High,
            ExpectedEffectiveness = 0.7,
            EstimatedTimeToImplement = TimeSpan.FromMinutes(15),
            Steps = new[]
            {
                "Review active database connections and query performance",
                "Check for blocking queries or lock contention",
                "Analyze recent query execution plans",
                "Consider scaling database resources if consistently overloaded"
            },
            AutomationAvailable = false,
            RunbookLink = "https://docs.company.com/runbooks/database-performance"
        });
    }

    return actions;
}
This intelligent alerting implementation shows how to build systems that provide high-quality alerts with rich context and actionable recommendations. The key insight is that effective alerting requires understanding not just what is happening but why it’s happening and what should be done about it.
Distributed Tracing: Following Requests Through Complex Systems
One of the most powerful observability techniques for distributed systems is distributed tracing, which allows us to follow individual requests as they flow through multiple services and components. This capability becomes essential when debugging performance issues or failures that span multiple system boundaries, providing visibility into the complete request lifecycle.
Understanding distributed tracing requires thinking about requests as journeys through your system rather than isolated events. Each request creates a trace that captures every step of its processing, from the initial API call through database queries, cache lookups, external service calls, and final response generation. This complete picture enables rapid identification of bottlenecks and failure points.
Our distributed tracing implementation integrates with Azure Application Insights to provide seamless correlation across all system components. When a user reports a slow redirect, we can trace that specific request through every component it touched, understanding exactly where time was spent and what might have caused the delay.
Operational Runbooks: Codifying Institutional Knowledge
The final piece of our observability architecture involves creating comprehensive operational runbooks that codify institutional knowledge and enable consistent, effective incident response. At scale, the complexity of system interactions makes it impossible for any individual to remember all the troubleshooting procedures and optimization techniques needed for effective operations.
Understanding effective runbook design requires thinking about runbooks as executable documentation that guides operators through complex procedures while capturing the reasoning behind each step. The most effective runbooks don’t just provide checklists – they explain the diagnostic reasoning, help operators understand what they’re looking for, and adapt their guidance based on what’s discovered during the investigation.
Our approach to operational excellence combines traditional runbooks with intelligent automation that can execute routine procedures while providing operators with the context needed to handle novel situations. This hybrid approach leverages automation for consistency while preserving human judgment for complex scenarios.
The Complete Observability Architecture: Transparency and Control
Throughout this exploration of observability and operational excellence, we’ve built a comprehensive monitoring system that transforms our URL shortener from a black box into a transparent, self-diagnosing platform. The sophisticated instrumentation, intelligent alerting, and operational automation we’ve implemented create a foundation for proactive system management that scales with complexity.
The integration between comprehensive telemetry collection, intelligent analysis, and automated response creates emergent capabilities that exceed what any individual component could provide. Performance issues are detected and analyzed automatically. Security threats trigger coordinated responses. Cost optimization opportunities are identified and implemented systematically. This creates a system that not only operates reliably at scale but becomes more intelligent and efficient over time.
Most importantly, this observability architecture provides the foundation for all the other capabilities we’ve built throughout this series. The security systems depend on comprehensive logging for threat detection. The performance optimization relies on detailed metrics for identifying bottlenecks. The cost management uses observability data to make intelligent resource decisions. Everything connects back to the fundamental principle of system transparency.
Coming Up in Part 8: “Deployment, DevOps, and Continuous Integration”
In our final installment, we’ll explore how to build deployment pipelines and DevOps practices that can safely deliver changes to systems serving millions of users. We’ll dive into Azure DevOps, implement sophisticated deployment strategies, and design continuous integration practices that maintain system reliability while enabling rapid innovation.
We’ll discover how the observability systems we’ve built provide the foundation for safe, automated deployments that can detect and respond to issues before they impact users. The monitoring and alerting capabilities become the safety net that enables confident, frequent deployments to production systems.
This is Part 7 of our 8-part series on building scalable systems with Azure. Each post builds upon previous concepts while exploring the observability techniques that transform complex systems into transparent, manageable platforms.
Series Navigation:
← Part 6: Performance Optimization and Cost Management
→ Part 8: Deployment, DevOps, and Continuous Integration – Coming Next Week


One thought on “Monitoring, Observability, and Operational Excellence: Building Systems That Tell Their Own Story”
Comments are closed.