Automatic instrumentation captures standard infrastructure metrics like request rates and database query durations, but business-critical insights require custom metrics tailored to your domain. Understanding which orders are being canceled, how inventory levels fluctuate, or how payment processing latency impacts revenue demands purpose-built measurement instruments. OpenTelemetry’s metrics API provides a sophisticated framework for recording these business-level measurements while Azure Monitor aggregates and visualizes them for operational decision-making.
This guide explores OpenTelemetry’s custom metrics capabilities, demonstrating how to choose appropriate metric instruments, implement business-specific measurements across .NET, Node.js, and Python, optimize metric cardinality for cost and performance, and build actionable dashboards in Azure Monitor that transform raw telemetry into business intelligence.
Understanding OpenTelemetry Metric Instruments
OpenTelemetry defines seven metric instruments, each optimized for different measurement patterns. Choosing the correct instrument affects both data accuracy and system performance.
graph TB
    subgraph Synchronous Instruments
        A[Counter]
        B[UpDownCounter]
        C[Histogram]
        D[Gauge]
    end

    subgraph Asynchronous Instruments
        E[Async Counter]
        F[Async UpDownCounter]
        G[Async Gauge]
    end

    subgraph Characteristics
        H[Monotonic Increasing]
        I[Can Increase/Decrease]
        J[Distribution Values]
        K[Point-in-Time Values]
    end

    A --> H
    E --> H
    B --> I
    F --> I
    C --> J
    D --> K
    G --> K

    subgraph Azure Monitor
        L[Custom Metrics Table]
        M[Aggregations: Sum, Count, Min, Max, Avg]
    end

    A --> L
    B --> L
    C --> L
    D --> L
    E --> L
    F --> L
    G --> L

    L --> M

    style A fill:#0078d4
    style B fill:#0078d4
    style C fill:#0078d4
    style D fill:#0078d4
Instrument Selection Guide
Counter: Records values that only increase. Use for tracking total requests processed, items sold, or errors encountered. Counters never decrease and reset only on application restart.
UpDownCounter: Records values that can increase or decrease. Use for active connections, queue depth, or items in shopping carts. This instrument tracks current state rather than accumulation.
Histogram: Records distribution of values across predefined buckets. Use for request durations, payload sizes, or transaction amounts where understanding percentiles matters more than totals.
Gauge: Records current value at observation time. Use for CPU temperature, memory usage, or current price where the instantaneous value is meaningful.
Asynchronous variants: Callback-based instruments that collect measurements during export rather than inline with application code. Use when measurements are expensive or when you need values only at collection intervals.
Implementing Custom Metrics in .NET
.NET’s System.Diagnostics.Metrics namespace provides the implementation for OpenTelemetry metrics. The Meter class acts as a factory for creating instruments.
Business Metrics Service
using System.Diagnostics.Metrics;
using Azure.Monitor.OpenTelemetry.AspNetCore;

var builder = WebApplication.CreateBuilder(args);

// Configure OpenTelemetry
builder.Services.AddOpenTelemetry().UseAzureMonitor();

// Register custom meter
builder.Services.ConfigureOpenTelemetryMeterProvider((sp, builder) =>
{
    builder.AddMeter("ECommerce.Metrics");
});

// Register business metrics service
builder.Services.AddSingleton();

var app = builder.Build();
app.Run();

public class BusinessMetrics
{
    private readonly Meter _meter;
    private readonly Counter _ordersPlaced;
    private readonly Counter _ordersCanceled;
    private readonly Histogram _orderValue;
    private readonly UpDownCounter _activeUsers;
    private readonly Histogram _checkoutDuration;

    public BusinessMetrics()
    {
        _meter = new Meter("ECommerce.Metrics", "1.0.0");

        // Counter for total orders placed
        _ordersPlaced = _meter.CreateCounter(
            "orders.placed",
            unit: "orders",
            description: "Total number of orders successfully placed"
        );

        // Counter for canceled orders
        _ordersCanceled = _meter.CreateCounter(
            "orders.canceled",
            unit: "orders",
            description: "Total number of canceled orders"
        );

        // Histogram for order values
        _orderValue = _meter.CreateHistogram(
            "order.value",
            unit: "USD",
            description: "Distribution of order values"
        );

        // UpDownCounter for active users
        _activeUsers = _meter.CreateUpDownCounter(
            "users.active",
            unit: "users",
            description: "Number of currently active users"
        );

        // Histogram for checkout duration
        _checkoutDuration = _meter.CreateHistogram(
            "checkout.duration",
            unit: "ms",
            description: "Time spent in checkout process"
        );
    }

    public void RecordOrderPlaced(double amount, string paymentMethod, string region)
    {
        _ordersPlaced.Add(1,
            new KeyValuePair("payment.method", paymentMethod),
            new KeyValuePair("region", region)
        );

        _orderValue.Record(amount,
            new KeyValuePair("payment.method", paymentMethod),
            new KeyValuePair("region", region)
        );
    }

    public void RecordOrderCanceled(string reason, string region)
    {
        _ordersCanceled.Add(1,
            new KeyValuePair("cancellation.reason", reason),
            new KeyValuePair("region", region)
        );
    }

    public void UserConnected()
    {
        _activeUsers.Add(1);
    }

    public void UserDisconnected()
    {
        _activeUsers.Add(-1);
    }

    public void RecordCheckoutDuration(double durationMs, bool successful)
    {
        _checkoutDuration.Record(durationMs,
            new KeyValuePair("checkout.successful", successful)
        );
    }
}
Using Business Metrics in Controllers
using Microsoft.AspNetCore.Mvc;
using System.Diagnostics;

[ApiController]
[Route("api/[controller]")]
public class OrdersController : ControllerBase
{
    private readonly BusinessMetrics _metrics;

    public OrdersController(BusinessMetrics metrics)
    {
        _metrics = metrics;
    }

    [HttpPost]
    public async Task CreateOrder([FromBody] OrderRequest request)
    {
        var stopwatch = Stopwatch.StartNew();

        try
        {
            // Process order
            var order = await ProcessOrderAsync(request);

            // Record successful order metrics
            _metrics.RecordOrderPlaced(
                request.TotalAmount,
                request.PaymentMethod,
                request.Region
            );

            stopwatch.Stop();
            _metrics.RecordCheckoutDuration(stopwatch.ElapsedMilliseconds, true);

            return Ok(order);
        }
        catch (Exception ex)
        {
            stopwatch.Stop();
            _metrics.RecordCheckoutDuration(stopwatch.ElapsedMilliseconds, false);

            return StatusCode(500, new { error = ex.Message });
        }
    }

    [HttpDelete("{orderId}")]
    public async Task CancelOrder(string orderId, [FromQuery] string reason)
    {
        await CancelOrderAsync(orderId);

        _metrics.RecordOrderCanceled(
            reason ?? "customer_request",
            GetUserRegion()
        );

        return Ok();
    }
}
Observable Gauges for System Metrics
using System.Diagnostics.Metrics;

public class SystemMetrics
{
    private readonly Meter _meter;
    private int _queueDepth = 0;
    private readonly object _lock = new object();

    public SystemMetrics()
    {
        _meter = new Meter("System.Metrics");

        // Observable gauge that reports queue depth
        _meter.CreateObservableGauge(
            "queue.depth",
            () => GetQueueDepth(),
            unit: "items",
            description: "Current number of items in processing queue"
        );

        // Observable gauge for memory usage
        _meter.CreateObservableGauge(
            "process.memory.usage",
            () => GC.GetTotalMemory(false) / 1024.0 / 1024.0,
            unit: "MB",
            description: "Current process memory usage"
        );

        // Observable gauge for thread count
        _meter.CreateObservableGauge(
            "process.thread.count",
            () => Process.GetCurrentProcess().Threads.Count,
            unit: "threads",
            description: "Current number of threads"
        );
    }

    private int GetQueueDepth()
    {
        lock (_lock)
        {
            return _queueDepth;
        }
    }

    public void EnqueueItem()
    {
        lock (_lock)
        {
            _queueDepth++;
        }
    }

    public void DequeueItem()
    {
        lock (_lock)
        {
            if (_queueDepth > 0)
                _queueDepth--;
        }
    }
}
Implementing Custom Metrics in Node.js
Node.js uses the @opentelemetry/api package for metrics instrumentation.
const { useAzureMonitor } = require("@azure/monitor-opentelemetry");
const { metrics } = require("@opentelemetry/api");
const express = require("express");

// Configure Azure Monitor
useAzureMonitor();

// Get meter instance
const meter = metrics.getMeter("ecommerce-api", "1.0.0");

// Create metric instruments
const ordersProcessedCounter = meter.createCounter("orders.processed", {
    description: "Total orders processed",
    unit: "orders"
});

const orderValueHistogram = meter.createHistogram("order.value", {
    description: "Distribution of order values",
    unit: "USD"
});

const activeConnectionsGauge = meter.createUpDownCounter("connections.active", {
    description: "Active WebSocket connections",
    unit: "connections"
});

const responseTimeHistogram = meter.createHistogram("api.response.time", {
    description: "API response time distribution",
    unit: "ms"
});

// Observable gauge for system metrics
const observableGauge = meter.createObservableGauge("system.memory.usage", {
    description: "Process memory usage",
    unit: "MB"
});

observableGauge.addCallback((observableResult) => {
    const memoryUsage = process.memoryUsage();
    observableResult.observe(memoryUsage.heapUsed / 1024 / 1024, {
        type: "heap"
    });
    observableResult.observe(memoryUsage.rss / 1024 / 1024, {
        type: "rss"
    });
});

const app = express();
app.use(express.json());

// Middleware to track response time
app.use((req, res, next) => {
    const start = Date.now();

    res.on("finish", () => {
        const duration = Date.now() - start;
        responseTimeHistogram.record(duration, {
            method: req.method,
            route: req.route?.path || "unknown",
            status: res.statusCode
        });
    });

    next();
});

app.post("/api/orders", (req, res) => {
    const { items, total, paymentMethod } = req.body;

    // Record order metrics
    ordersProcessedCounter.add(1, {
        payment_method: paymentMethod,
        item_count: items.length
    });

    orderValueHistogram.record(total, {
        payment_method: paymentMethod,
        currency: "USD"
    });

    res.json({
        orderId: `ORD-${Date.now()}`,
        status: "confirmed"
    });
});

// WebSocket connection tracking
const WebSocket = require("ws");
const wss = new WebSocket.Server({ port: 8080 });

wss.on("connection", (ws) => {
    activeConnectionsGauge.add(1);

    ws.on("close", () => {
        activeConnectionsGauge.add(-1);
    });
});

app.listen(3000);
Implementing Custom Metrics in Python
import os
import time
import psutil
from flask import Flask, request, jsonify
from azure.monitor.opentelemetry import configure_azure_monitor
from opentelemetry import metrics

configure_azure_monitor(
    connection_string=os.environ.get("APPLICATIONINSIGHTS_CONNECTION_STRING")
)

# Get meter instance
meter = metrics.get_meter("ecommerce.api", "1.0.0")

# Create metric instruments
orders_counter = meter.create_counter(
    name="orders.processed",
    description="Total orders processed",
    unit="orders"
)

order_value_histogram = meter.create_histogram(
    name="order.value",
    description="Distribution of order values",
    unit="USD"
)

inventory_gauge = meter.create_up_down_counter(
    name="inventory.level",
    description="Current inventory levels",
    unit="items"
)

processing_time_histogram = meter.create_histogram(
    name="order.processing.time",
    description="Order processing time",
    unit="ms"
)

# Observable gauge for system metrics
def get_cpu_usage():
    return psutil.cpu_percent()

def get_memory_usage():
    return psutil.virtual_memory().percent

cpu_gauge = meter.create_observable_gauge(
    name="system.cpu.usage",
    callbacks=[lambda options: [(get_cpu_usage(), {})]],
    description="CPU usage percentage",
    unit="%"
)

memory_gauge = meter.create_observable_gauge(
    name="system.memory.usage",
    callbacks=[lambda options: [(get_memory_usage(), {})]],
    description="Memory usage percentage",
    unit="%"
)

app = Flask(__name__)

class InventoryManager:
    def __init__(self):
        self.inventory = {}

    def add_stock(self, product_id, quantity):
        if product_id not in self.inventory:
            self.inventory[product_id] = 0
        self.inventory[product_id] += quantity

        inventory_gauge.add(quantity, {
            "product_id": str(product_id),
            "operation": "restock"
        })

    def remove_stock(self, product_id, quantity):
        if product_id in self.inventory and self.inventory[product_id] >= quantity:
            self.inventory[product_id] -= quantity

            inventory_gauge.add(-quantity, {
                "product_id": str(product_id),
                "operation": "sale"
            })
            return True
        return False

inventory = InventoryManager()

@app.route("/api/orders", methods=["POST"])
def create_order():
    start_time = time.time()

    data = request.get_json()
    product_id = data.get("product_id")
    quantity = data.get("quantity", 1)
    total = data.get("total", 0)
    payment_method = data.get("payment_method", "credit_card")

    # Check inventory
    if not inventory.remove_stock(product_id, quantity):
        processing_time = (time.time() - start_time) * 1000
        processing_time_histogram.record(processing_time, {
            "status": "failed",
            "reason": "insufficient_inventory"
        })
        return jsonify({"error": "Insufficient inventory"}), 400

    # Record metrics
    orders_counter.add(1, {
        "payment_method": payment_method,
        "status": "success"
    })

    order_value_histogram.record(total, {
        "payment_method": payment_method,
        "currency": "USD"
    })

    processing_time = (time.time() - start_time) * 1000
    processing_time_histogram.record(processing_time, {
        "status": "success"
    })

    return jsonify({
        "order_id": f"ORD-{int(time.time())}",
        "status": "confirmed"
    })

@app.route("/api/inventory/restock", methods=["POST"])
def restock():
    data = request.get_json()
    product_id = data.get("product_id")
    quantity = data.get("quantity")

    inventory.add_stock(product_id, quantity)

    return jsonify({"status": "restocked"})

if __name__ == "__main__":
    # Initialize inventory
    inventory.add_stock(1, 100)
    inventory.add_stock(2, 50)

    app.run(port=5000)
Metric Cardinality and Cost Optimization
High-cardinality dimensions create exponential combinations of metric time series, significantly impacting both performance and Azure Monitor costs. Each unique combination of attribute values creates a separate time series that Azure Monitor stores and indexes.
Cardinality Example
// High cardinality - AVOID
ordersCounter.Add(1,
    new KeyValuePair("user.id", userId),           // 1M+ unique values
    new KeyValuePair("order.id", orderId),         // 10M+ unique values
    new KeyValuePair("timestamp", DateTime.Now)     // Infinite unique values
);
// Potential time series: 1M * 10M * ∞ = Extremely expensive

// Low cardinality - RECOMMENDED
ordersCounter.Add(1,
    new KeyValuePair("region", region),            // 10 unique values
    new KeyValuePair("payment.method", method),    // 5 unique values
    new KeyValuePair("order.type", orderType)      // 3 unique values
);
// Potential time series: 10 * 5 * 3 = 150 time series
Cardinality Best Practices
- Never use user IDs, order IDs, session IDs, or timestamps as metric dimensions
- Limit dimension values to known, bounded sets (regions, product categories, payment methods)
- Use dimension values that enable meaningful aggregation (not overly specific)
- Monitor unique time series count in Azure Monitor to identify cardinality explosions
- Consider sampling or aggregating high-cardinality data before creating metrics
Querying Custom Metrics in Azure Monitor
Custom metrics appear in the Application Insights customMetrics table. Use Kusto Query Language (KQL) to query and aggregate metric data.
// Query counter metrics
customMetrics
| where name == "orders.processed"
| where timestamp > ago(1h)
| summarize TotalOrders = sum(value) by bin(timestamp, 5m), tostring(customDimensions.payment_method)
| render timechart

// Query histogram percentiles
customMetrics
| where name == "order.value"
| where timestamp > ago(24h)
| summarize
    p50 = percentile(value, 50),
    p95 = percentile(value, 95),
    p99 = percentile(value, 99)
    by bin(timestamp, 1h)
| render timechart

// Analyze gauge metrics
customMetrics
| where name == "users.active"
| where timestamp > ago(1h)
| summarize AvgActiveUsers = avg(value) by bin(timestamp, 1m)
| render timechart

// Compare metrics across dimensions
customMetrics
| where name == "orders.processed"
| where timestamp > ago(7d)
| summarize TotalOrders = sum(value) by tostring(customDimensions.region)
| render barchart
Building Dashboards with Custom Metrics
Azure Monitor dashboards transform raw metrics into actionable visualizations. Create tiles that display KPIs, trend lines, and comparative analysis across metric dimensions.
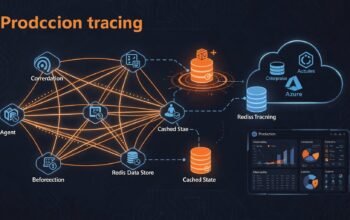
Next in the Series
This guide covered custom metrics implementation with OpenTelemetry and Azure Monitor. The final article in this series explores production monitoring patterns, demonstrating how to implement sampling strategies, configure alerts on custom metrics, optimize telemetry costs, and build comprehensive observability solutions for enterprise applications.