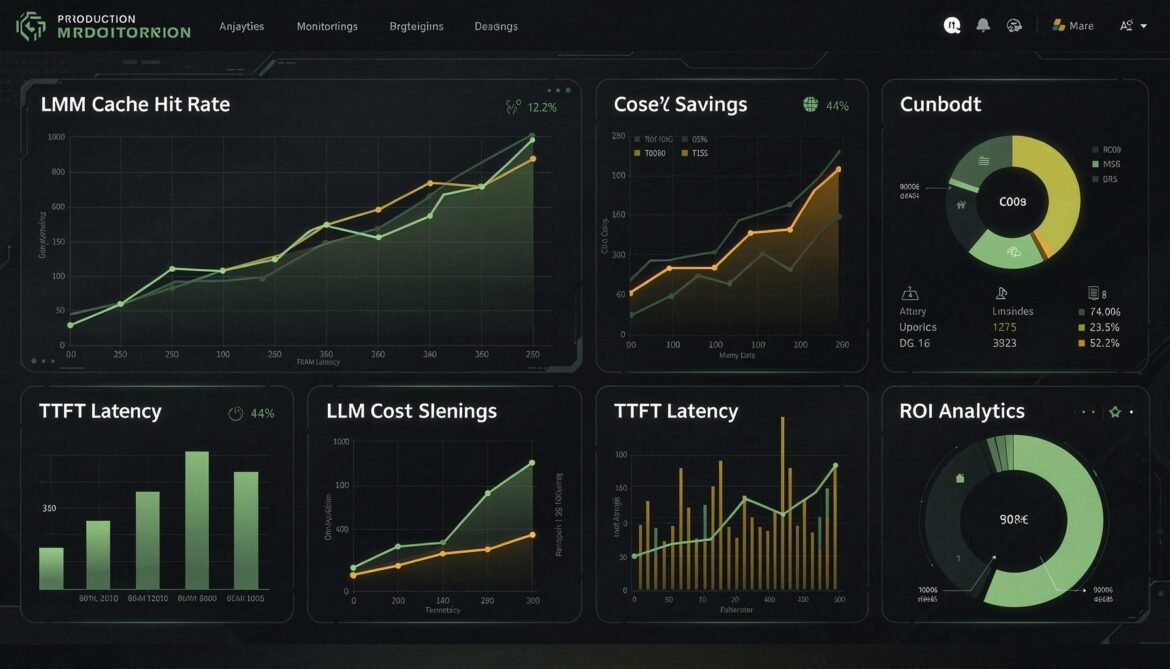
Shipping caching without monitoring is flying blind. This final part covers how to build cache hit rate dashboards, measure time-to-first-token improvements, calculate real cost savings with accuracy, detect cache regression before users notice, and build the business case for continued caching investment.
Tag: OpenTelemetry
Building a Complete LLMOps Stack: From Zero to Production-Grade Observability
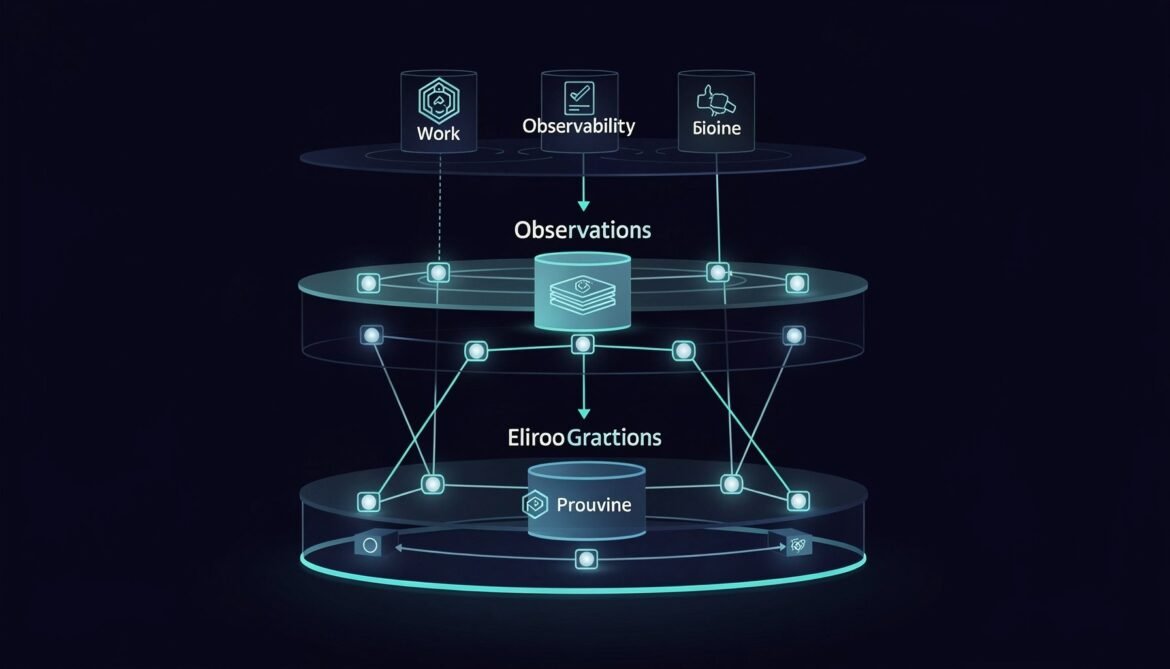
Seven posts, seven production systems. This final installment assembles every piece — distributed tracing, metrics, evaluation, prompt versioning, RAG observability, and cost governance — into one reference architecture with a phased implementation checklist you can start using this week.
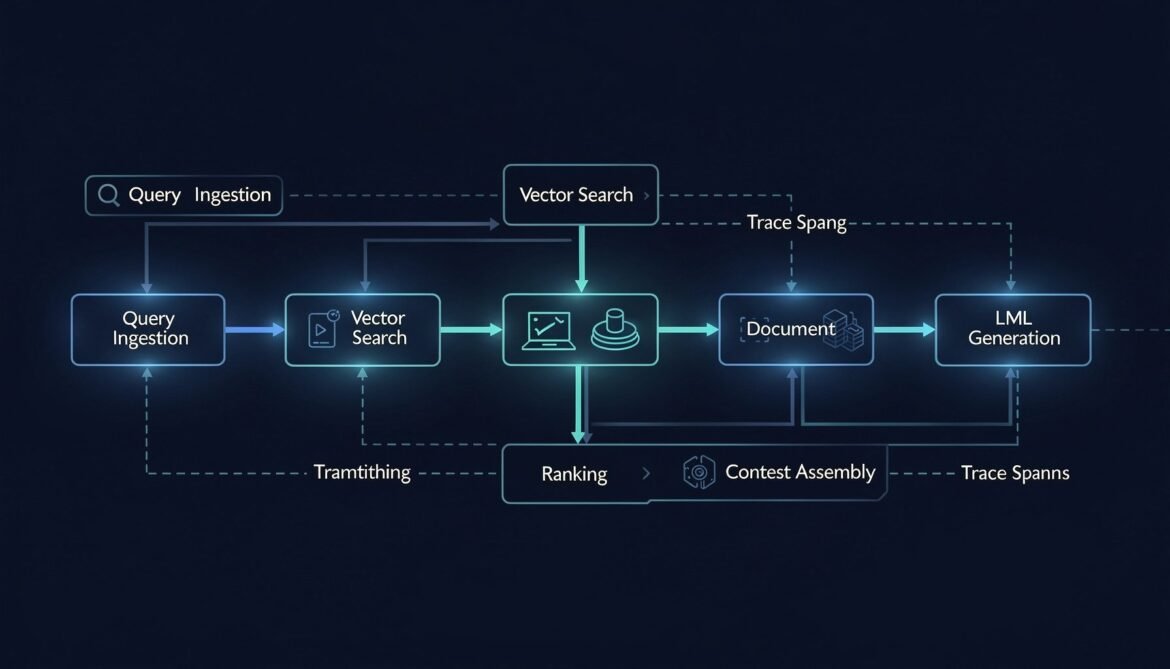
RAG Pipeline Observability: Tracing Retrieval, Chunking, and Embedding Quality
A RAG pipeline has five distinct places it can fail before the LLM ever sees your context. This post instruments every stage — query embedding, vector search, document ranking, context assembly, and generation — with OpenTelemetry spans and quality metrics, in Node.js, Python, and C#.
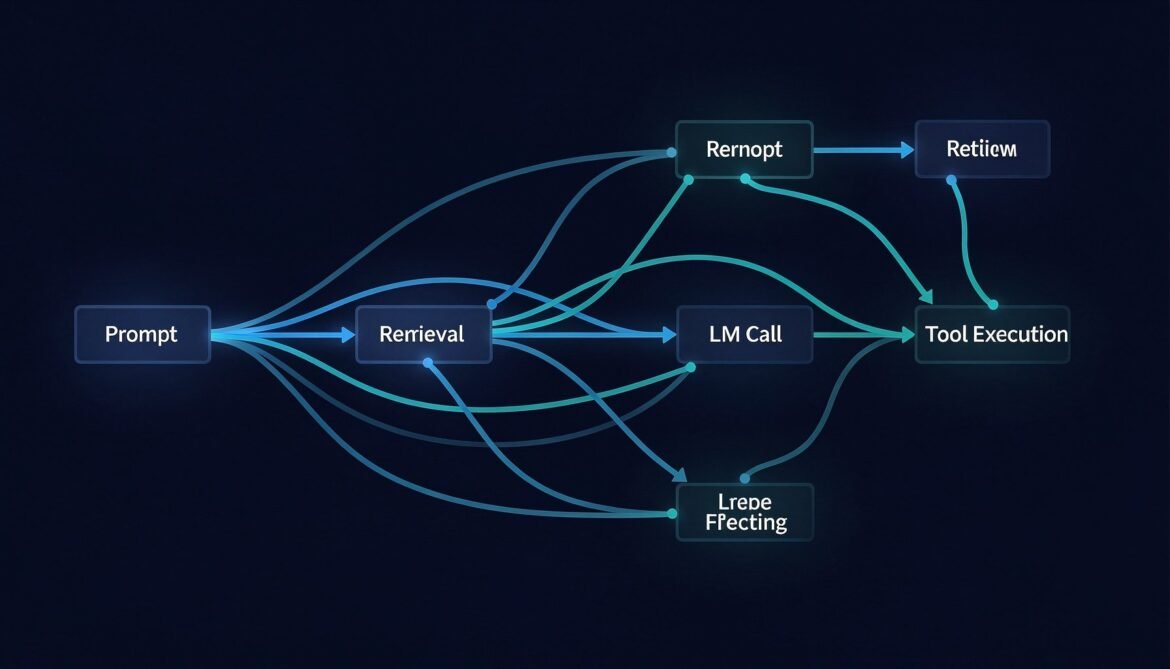
Distributed Tracing for LLM Applications with OpenTelemetry
You cannot fix what you cannot see. This post walks through instrumenting a full LLM pipeline with OpenTelemetry in Node.js, Python, and C# — capturing every span from user request through retrieval, model call, tool execution, and response.
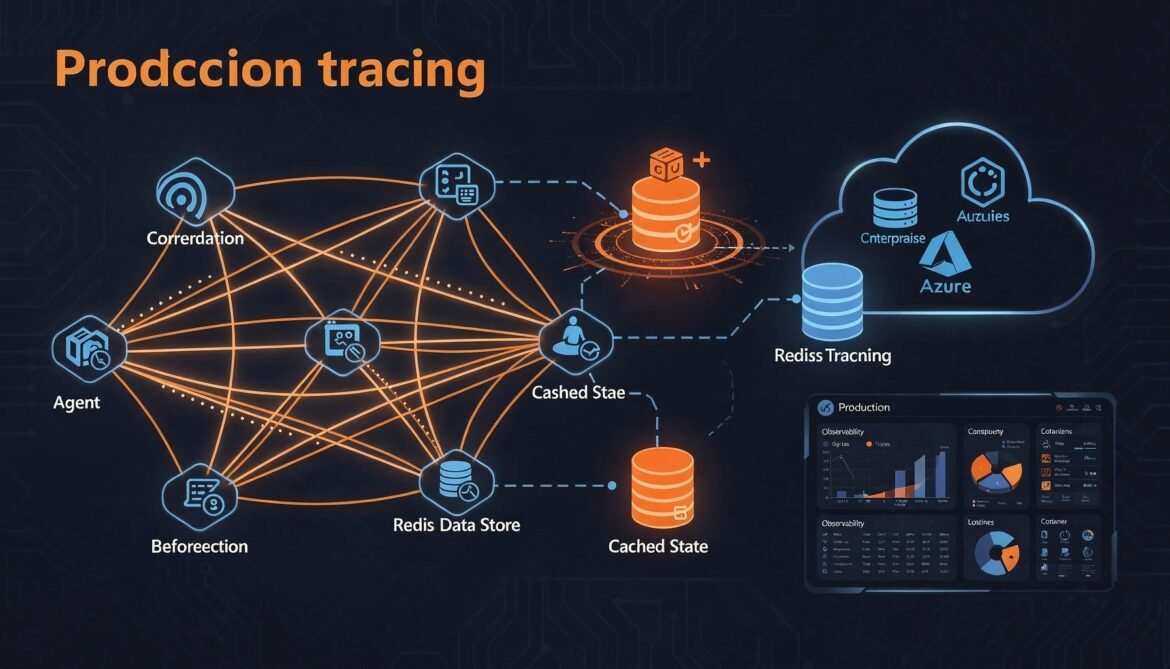
A2A in Production: Observability, Governance and Scaling (Part 8 of 8)
Take your A2A multi-agent system to production. Covers distributed tracing with OpenTelemetry across agent hops, structured logging with trace correlation, Redis-backed task store for horizontal scaling, and deployment on Azure Container Apps.
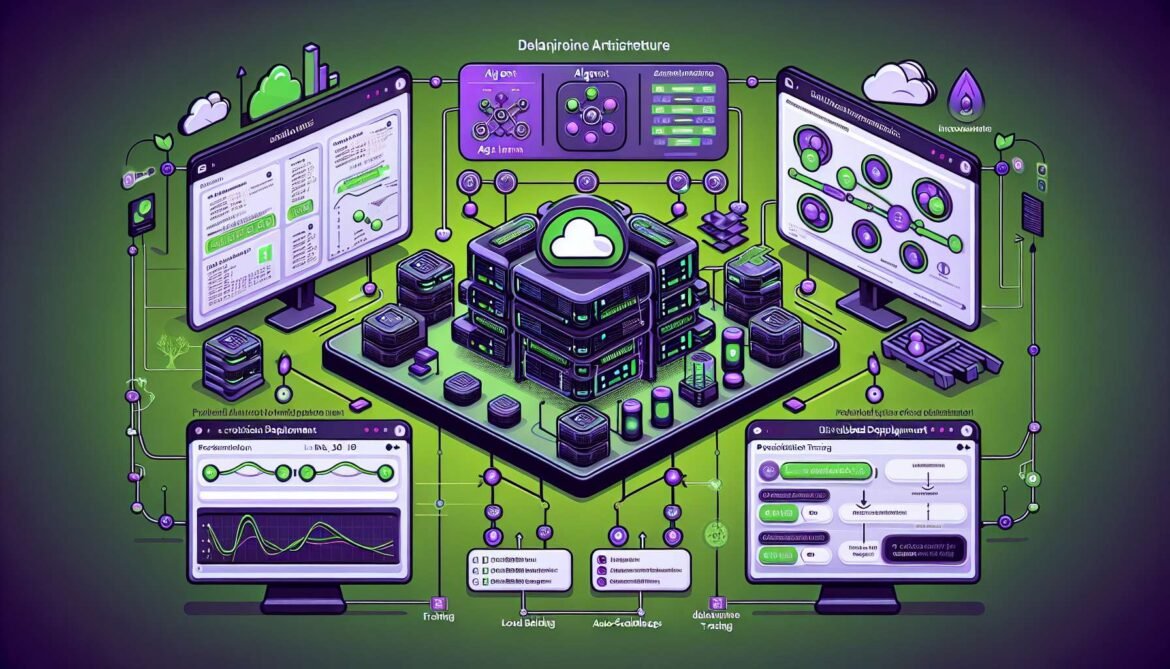
Production Deployment Strategies for AI Agents at Scale
Deploy AI agents to production with Kubernetes orchestration, OpenTelemetry observability, and cost management. Complete guide covering infrastructure patterns, distributed tracing, monitoring strategies, and enterprise deployment on Azure, AWS, and GCP.

Azure Monitor with OpenTelemetry Part 7: Production Monitoring and Observability Patterns
Master production observability with OpenTelemetry and Azure Monitor. Learn intelligent sampling strategies, actionable alerting patterns, performance optimization, cost management, operational dashboards, and incident response integration for enterprise-scale applications.

Azure Monitor with OpenTelemetry Part 6: Custom Metrics and Advanced Telemetry
Implement custom business metrics with OpenTelemetry counters, histograms, and gauges in .NET, Node.js, and Python. Learn instrument selection, cardinality optimization, Azure Monitor querying with KQL, and building actionable dashboards for production observability.

Azure Monitor with OpenTelemetry Part 5: Distributed Tracing Across Microservices
Master distributed tracing across microservices with OpenTelemetry and Azure Monitor. Learn W3C TraceContext propagation, automatic and manual context injection, cross-service correlation in .NET, Node.js, and Python, and troubleshooting broken traces in production environments.

Azure Monitor with OpenTelemetry Part 4: Python Applications with OpenTelemetry and Azure Monitor
Instrument Python Flask and FastAPI applications with Azure Monitor OpenTelemetry Distro for comprehensive observability. Learn automatic instrumentation, custom spans with tracers, custom metrics, logging integration, database tracking, and production configuration patterns.


