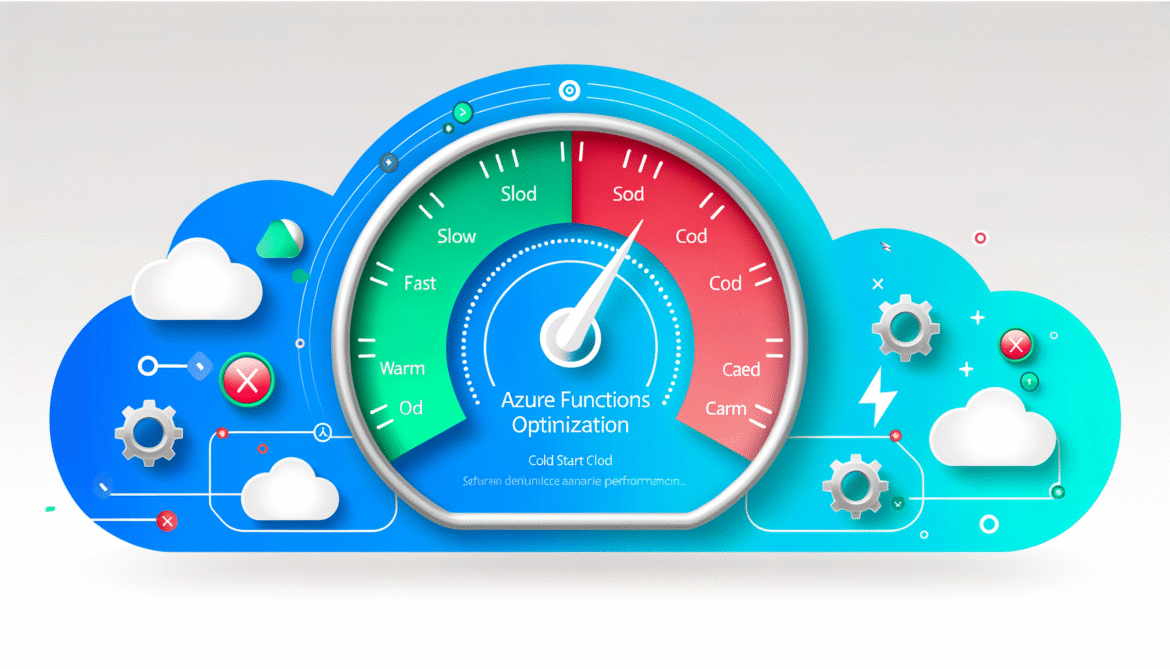
Azure Functions Cold Start Optimization: Understanding the Fundamentals
Part 1: Cold Start Fundamentals & Basic Optimization Techniques
Cold starts are one of the most discussed challenges in serverless computing, and Azure Functions is no exception. Understanding what causes cold starts, how to measure their impact, and implementing basic optimization techniques can dramatically improve your application’s performance and user experience.
What Are Cold Starts and Why Do They Matter?
A cold start occurs when Azure Functions needs to initialize a new execution environment for your function. This happens when:
- Your function hasn’t been invoked for a certain period (typically 5-20 minutes)
- Azure needs to scale out to handle increased load
- Your function code or configuration has been updated
- The underlying infrastructure requires maintenance
The Cold Start Process
# Cold start execution flow
1. Container Allocation     (50-200ms)
   ↓
2. Runtime Initialization   (100-500ms)
   ↓
3. Language Worker Start    (200-1000ms)
   ↓
4. Function Host Start      (100-300ms)
   ↓
5. Your Code Initialization (Variable - depends on your code)
   ↓
6. Function Execution       (Your actual function logic)
Real-World Impact: Cold starts can add anywhere from 500ms to 10+ seconds to your function’s response time, which can be critical for user-facing applications or time-sensitive integrations.
Measuring Cold Start Performance
Before optimizing, you need to establish baselines and understand your current performance.
Application Insights Integration
# C# example with custom telemetry
using Microsoft.ApplicationInsights;
using Microsoft.ApplicationInsights.DataContracts;

public static class ColdStartTracker
{
    private static readonly TelemetryClient TelemetryClient = new TelemetryClient();
    private static bool _isColdStart = true;

    [FunctionName("OptimizedFunction")]
    public static async Task<IActionResult> Run(
        [HttpTrigger(AuthorizationLevel.Function, "get", "post")] HttpRequest req,
        ILogger log)
    {
        var stopwatch = Stopwatch.StartNew();

        // Track if this is a cold start
        var telemetry = new EventTelemetry("FunctionExecution");
        telemetry.Properties["IsColdStart"] = _isColdStart.ToString();
        telemetry.Properties["FunctionName"] = "OptimizedFunction";

        if (_isColdStart)
        {
            log.LogInformation("Cold start detected");
            _isColdStart = false;
        }

        // Your function logic here
        var result = await ProcessRequest(req);

        stopwatch.Stop();
        telemetry.Metrics["ExecutionTimeMs"] = stopwatch.ElapsedMilliseconds;
        TelemetryClient.TrackEvent(telemetry);

        return result;
    }
}
Key Performance Insights Query
// Application Insights KQL query for cold start analysis
customEvents
| where name == "FunctionExecution"
| extend IsColdStart = tobool(customDimensions["IsColdStart"])
| extend ExecutionTime = todouble(customMeasurements["ExecutionTimeMs"])
| summarize
    ColdStartCount = countif(IsColdStart == true),
    WarmStartCount = countif(IsColdStart == false),
    AvgColdStartTime = avgif(ExecutionTime, IsColdStart == true),
    AvgWarmStartTime = avgif(ExecutionTime, IsColdStart == false),
    P95ColdStart = percentile(ExecutionTime, 95) by bin(timestamp, 1h)
| render timechart
Fundamental Optimization Techniques
1. Choose the Right Runtime and Language
| Runtime | Typical Cold Start | Memory Usage | Best For |
|---|---|---|---|
| C# (.NET 8) | 200-800ms | Low-Medium | Enterprise applications, complex logic |
| JavaScript/Node.js | 100-400ms | Low | Simple APIs, quick processing |
| Python | 300-1000ms | Medium | Data processing, ML integration |
| PowerShell | 1000-3000ms | High | Automation, Azure management |
| Java | 2000-5000ms | High | Enterprise Java applications |
2. Optimize Package Size and Dependencies
# JavaScript/Node.js optimization example

# ❌ Bad: Large bundle with unnecessary dependencies
{
  "dependencies": {
    "lodash": "^4.17.21",        // 700KB+ for simple utilities
    "moment": "^2.29.4",         // 300KB+ for date handling
    "aws-sdk": "^2.1000.0",      // Massive SDK when you only need one service
    "entire-ui-library": "^1.0.0" // UI library in a backend function
  }
}

# ✅ Good: Minimal, targeted dependencies
{
  "dependencies": {
    "lodash.get": "^4.4.2",      // Only the specific utility needed
    "date-fns": "^2.29.3",       // Lightweight alternative to moment
    "@azure/storage-blob": "^12.12.0" // Specific service SDK
  }
}

# Bundle analysis for optimization
npm install --save-dev webpack-bundle-analyzer
npx webpack-bundle-analyzer dist/main.js
3. Implement Lazy Loading and Initialization
# C# example with lazy initialization
public static class DatabaseService
{
    private static readonly Lazy<SqlConnection> _connection = new Lazy<SqlConnection>(() =>
    {
        var connectionString = Environment.GetEnvironmentVariable("SqlConnectionString");
        return new SqlConnection(connectionString);
    });

    private static readonly Lazy<HttpClient> _httpClient = new Lazy<HttpClient>(() =>
    {
        var client = new HttpClient();
        client.DefaultRequestHeaders.Add("User-Agent", "MyFunction/1.0");
        client.Timeout = TimeSpan.FromSeconds(30);
        return client;
    });

    public static SqlConnection Connection => _connection.Value;
    public static HttpClient HttpClient => _httpClient.Value;
}

[FunctionName("OptimizedDataFunction")]
public static async Task<IActionResult> Run(
    [HttpTrigger(AuthorizationLevel.Function, "get")] HttpRequest req,
    ILogger log)
{
    // Connections are only initialized when first accessed
    // Subsequent calls reuse the same instances
    using var command = new SqlCommand("SELECT * FROM Users", DatabaseService.Connection);

    // Execute your logic
    var result = await command.ExecuteScalarAsync();

    return new OkObjectResult(result);
}
4. Connection Pooling and Reuse
# Node.js example with connection pooling
const { Pool } = require('pg');

// ❌ Bad: Creating new connections each time
module.exports = async function (context, req) {
    const client = new Client({
        connectionString: process.env.DATABASE_URL
    });
    await client.connect();

    // Your logic here
    const result = await client.query('SELECT * FROM users');

    await client.end(); // Connection closed every time
    return result;
};

// ✅ Good: Connection pooling with reuse
const pool = new Pool({
    connectionString: process.env.DATABASE_URL,
    max: 1, // Single connection for serverless
    idleTimeoutMillis: 30000,
    connectionTimeoutMillis: 2000,
});

module.exports = async function (context, req) {
    try {
        // Reuse existing connection from pool
        const client = await pool.connect();
        const result = await client.query('SELECT * FROM users');
        client.release(); // Return to pool, don't close

        return {
            status: 200,
            body: result.rows
        };
    } catch (error) {
        context.log.error('Database error:', error);
        throw error;
    }
};
5. Optimize Function Configuration
# host.json optimization
{
  "version": "2.0",
  "functionTimeout": "00:05:00",
  "extensions": {
    "http": {
      "routePrefix": "api",
      "maxConcurrentRequests": 100
    }
  },
  "extensionBundle": {
    "id": "Microsoft.Azure.Functions.ExtensionBundle",
    "version": "[3.*, 4.0.0)"  // Use latest stable bundle
  },
  "logging": {
    "logLevel": {
      "default": "Information",
      "Function": "Information"
    }
  },
  "retry": {
    "strategy": "exponentialBackoff",
    "maxRetryCount": 3,
    "minimumInterval": "00:00:02",
    "maximumInterval": "00:00:30"
  }
}
Code-Level Optimization Strategies
Avoid Heavy Initialization in Static Constructors
# Python example showing good vs bad patterns

# ❌ Bad: Heavy work in module-level initialization
import requests
import pandas as pd
from sklearn.model_selection import train_test_split

# This runs during cold start!
expensive_data = pd.read_csv('https://huge-dataset.com/data.csv')
model = load_machine_learning_model()  # Takes 2-3 seconds

def main(req):
    # Function logic here
    prediction = model.predict(req.get_json())
    return prediction

# ✅ Good: Lazy initialization pattern
import requests
import pandas as pd
from sklearn.model_selection import train_test_split

# Global variables for caching
_expensive_data = None
_model = None

def get_data():
    global _expensive_data
    if _expensive_data is None:
        _expensive_data = pd.read_csv('https://huge-dataset.com/data.csv')
    return _expensive_data

def get_model():
    global _model
    if _model is None:
        _model = load_machine_learning_model()
    return _model

def main(req):
    # Only load when needed, cache for subsequent calls
    model = get_model()
    prediction = model.predict(req.get_json())
    return prediction
Environment Variable Optimization
# Optimize environment variable access
public static class AppSettings
{
    // ❌ Bad: Reading env vars on every call
    public static string GetDatabaseConnection()
    {
        return Environment.GetEnvironmentVariable("DatabaseConnectionString");
    }

    // ✅ Good: Cache environment variables
    private static readonly string _databaseConnection =
        Environment.GetEnvironmentVariable("DatabaseConnectionString");

    private static readonly string _apiKey =
        Environment.GetEnvironmentVariable("ApiKey");

    public static string DatabaseConnection => _databaseConnection;
    public static string ApiKey => _apiKey;
}

// Use throughout your function
[FunctionName("OptimizedFunction")]
public static async Task<IActionResult> Run(
    [HttpTrigger(AuthorizationLevel.Function, "get")] HttpRequest req)
{
    // Fast access to cached values
    using var connection = new SqlConnection(AppSettings.DatabaseConnection);
    // Function logic here
}
Cold Start Performance Benchmarks
Before and After Optimization Examples
| Optimization | Before | After | Improvement |
|---|---|---|---|
| Package size reduction (Node.js) | 2.1s | 0.8s | 62% faster |
| Lazy initialization (.NET) | 1.5s | 0.6s | 60% faster |
| Connection pooling (Python) | 1.8s | 0.7s | 61% faster |
| Environment variable caching | 0.9s | 0.7s | 22% faster |
Monitoring and Alerting Setup
# Azure Monitor alert for cold start detection
az monitor metrics alert create \
  --name "High-ColdStart-Alert" \
  --resource-group "my-functions-rg" \
  --scopes "/subscriptions/.../providers/Microsoft.Web/sites/my-function-app" \
  --condition "avg FunctionExecutionUnits > 1000" \
  --description "Alert when cold starts cause high execution units" \
  --evaluation-frequency 5m \
  --window-size 15m \
  --severity 2 \
  --action-group "/subscriptions/.../actionGroups/dev-team-alerts"

# Custom metric tracking
# Add this to your function code
public static void TrackColdStartMetric(bool isColdStart, double executionTime)
{
    var telemetryClient = new TelemetryClient();

    telemetryClient.TrackMetric("ColdStartOccurrence", isColdStart ? 1 : 0, new Dictionary<string, string>
    {
        ["FunctionName"] = "MyFunction",
        ["Runtime"] = "dotnet"
    });

    telemetryClient.TrackMetric("ExecutionTime", executionTime, new Dictionary<string, string>
    {
        ["StartType"] = isColdStart ? "Cold" : "Warm"
    });
}
What’s Coming Next
In Part 2, we’ll dive deep into the Premium vs Consumption plan decision with detailed cost analysis, real-world scenarios, and decision frameworks to help you choose the right hosting plan for your specific needs.
In Part 3, we’ll explore advanced optimization techniques including pre-warming strategies, advanced monitoring setups, and emerging solutions in the Azure Functions ecosystem.
Cold start optimization is a journey, not a destination. Start with these fundamental techniques and measure their impact on your specific workloads. The key is finding the right balance between performance and complexity for your use case.


