Production deployment transforms MCP servers from development experiments into reliable enterprise services. This guide covers containerization strategies, CI/CD automation, monitoring systems, and performance optimization techniques that ensure your MCP servers operate at production scale with enterprise-grade reliability.
Containerization and Orchestration
Container orchestration platforms like Kubernetes provide the foundation for production MCP deployments. Docker containers encapsulate server dependencies and configuration, enabling consistent deployment across development, staging, and production environments. Kubernetes orchestrates multiple container instances, handling load balancing, health checks, and automatic recovery from failures.
# Kubernetes deployment for production MCP server
apiVersion: apps/v1
kind: Deployment
metadata:
  name: mcp-production-server
  namespace: ai-services
spec:
  replicas: 3
  strategy:
    type: RollingUpdate
    rollingUpdate:
      maxUnavailable: 1
      maxSurge: 1
  selector:
    matchLabels:
      app: mcp-server
  template:
    metadata:
      labels:
        app: mcp-server
        version: v1.2.0
    spec:
      containers:
      - name: mcp-server
        image: your-registry.azurecr.io/mcp-server:v1.2.0
        ports:
        - containerPort: 8080
          name: http
          protocol: TCP
        resources:
          requests:
            memory: "256Mi"
            cpu: "250m"
          limits:
            memory: "512Mi"
            cpu: "500m"
        livenessProbe:
          httpGet:
            path: /health
            port: 8080
          initialDelaySeconds: 30
          periodSeconds: 10
          timeoutSeconds: 5
        readinessProbe:
          httpGet:
            path: /ready
            port: 8080
          initialDelaySeconds: 5
          periodSeconds: 5
          timeoutSeconds: 3
        env:
        - name: MCP_DATABASE_URL
          valueFrom:
            secretKeyRef:
              name: mcp-secrets
              key: database-url
        - name: OTEL_EXPORTER_OTLP_ENDPOINT
          value: "http://otel-collector:4318"
---
apiVersion: autoscaling/v2
kind: HorizontalPodAutoscaler
metadata:
  name: mcp-server-hpa
  namespace: ai-services
spec:
  scaleTargetRef:
    apiVersion: apps/v1
    kind: Deployment
    name: mcp-production-server
  minReplicas: 3
  maxReplicas: 10
  metrics:
  - type: Resource
    resource:
      name: cpu
      target:
        type: Utilization
        averageUtilization: 70
  - type: Resource
    resource:
      name: memory
      target:
        type: Utilization
        averageUtilization: 80
CI/CD Pipeline Automation
Automated deployment pipelines ensure consistent, repeatable releases while maintaining code quality through automated testing. GitHub Actions provides comprehensive CI/CD capabilities for MCP server deployment, integrating testing, security scanning, and multi-environment deployment workflows.
# .github/workflows/deploy-mcp-server.yml
name: Deploy MCP Server

on:
  push:
    tags:
      - 'v*'
  workflow_dispatch:
    inputs:
      environment:
        description: 'Deployment environment'
        required: true
        type: choice
        options:
          - staging
          - production

jobs:
  build:
    runs-on: ubuntu-latest
    steps:
      - uses: actions/checkout@v4

      - name: Setup Node.js
        uses: actions/setup-node@v4
        with:
          node-version: '20'
          cache: 'npm'

      - name: Install dependencies
        run: npm ci

      - name: Run tests
        run: npm test

      - name: Build
        run: npm run build

      - name: Login to Azure Container Registry
        uses: azure/docker-login@v1
        with:
          login-server: your-registry.azurecr.io
          username: ${{ secrets.ACR_USERNAME }}
          password: ${{ secrets.ACR_PASSWORD }}

      - name: Build and push Docker image
        run: |
          docker build -t your-registry.azurecr.io/mcp-server:${{ github.sha }} .
          docker push your-registry.azurecr.io/mcp-server:${{ github.sha }}

  deploy:
    needs: build
    runs-on: ubuntu-latest
    environment: ${{ github.event.inputs.environment || 'production' }}
    steps:
      - name: Setup kubectl
        uses: azure/setup-kubectl@v3

      - name: Deploy to Kubernetes
        run: |
          kubectl set image deployment/mcp-production-server \
            mcp-server=your-registry.azurecr.io/mcp-server:${{ github.sha }} \
            -n ai-services

          kubectl rollout status deployment/mcp-production-server -n ai-services
Observability with OpenTelemetry
Production monitoring requires comprehensive observability covering metrics, logs, and distributed traces. OpenTelemetry provides vendor-neutral instrumentation that integrates with platforms like Prometheus, Grafana, and Jaeger, enabling end-to-end visibility into MCP server operations.
# Python: OpenTelemetry instrumentation for MCP server
from opentelemetry import trace, metrics
from opentelemetry.exporter.otlp.proto.http.trace_exporter import OTLPSpanExporter
from opentelemetry.exporter.otlp.proto.http.metric_exporter import OTLPMetricExporter
from opentelemetry.sdk.trace import TracerProvider
from opentelemetry.sdk.trace.export import BatchSpanProcessor
from opentelemetry.sdk.metrics import MeterProvider
from opentelemetry.sdk.metrics.export import PeriodicExportingMetricReader
from opentelemetry.instrumentation.fastapi import FastAPIInstrumentor

# Configure trace provider
trace_provider = TracerProvider()
trace_provider.add_span_processor(
    BatchSpanProcessor(
        OTLPSpanExporter(endpoint="http://otel-collector:4318/v1/traces")
    )
)
trace.set_tracer_provider(trace_provider)

# Configure metrics provider
metric_reader = PeriodicExportingMetricReader(
    OTLPMetricExporter(endpoint="http://otel-collector:4318/v1/metrics")
)
metrics.set_meter_provider(MeterProvider(metric_readers=[metric_reader]))

# Instrument FastMCP automatically
FastAPIInstrumentor.instrument_app(app)

# Create custom metrics
meter = metrics.get_meter(__name__)
tool_call_counter = meter.create_counter(
    "mcp.tool.calls",
    description="Number of tool calls",
    unit="1"
)
tool_duration = meter.create_histogram(
    "mcp.tool.duration",
    description="Tool execution duration",
    unit="ms"
)

@mcp.tool()
async def production_tool(param: str) -> str:
    """Production tool with observability."""
    tool_call_counter.add(1, {"tool_name": "production_tool"})

    start_time = time.time()
    try:
        result = await execute_tool_logic(param)
        return result
    finally:
        duration = (time.time() - start_time) * 1000
        tool_duration.record(duration, {"tool_name": "production_tool"})
Performance Optimization Strategies
Production optimization balances resource efficiency with response time requirements. Connection pooling, caching strategies, and async processing reduce latency and improve throughput. Implement these patterns systematically across database access, external API calls, and resource-intensive operations.
# Node.js: Performance optimization patterns
import { createPool } from 'generic-pool';
import Redis from 'ioredis';

// Connection pool for database
const dbPool = createPool({
  create: async () => {
    return await createDatabaseConnection();
  },
  destroy: async (client) => {
    await client.close();
  }
}, {
  min: 2,
  max: 10,
  acquireTimeoutMillis: 3000
});

// Redis cache for frequently accessed data
const redis = new Redis({
  host: process.env.REDIS_HOST,
  port: 6379,
  maxRetriesPerRequest: 3,
  enableReadyCheck: true
});

server.setRequestHandler(CallToolRequestSchema, async (request) => {
  const { name, arguments: args } = request.params;

  // Cache key based on tool and arguments
  const cacheKey = `tool:${name}:${JSON.stringify(args)}`;

  // Check cache first
  const cached = await redis.get(cacheKey);
  if (cached) {
    return JSON.parse(cached);
  }

  // Execute tool with database connection from pool
  const db = await dbPool.acquire();
  try {
    const result = await executeTool(db, name, args);

    // Cache result for 5 minutes
    await redis.setex(cacheKey, 300, JSON.stringify(result));

    return result;
  } finally {
    await dbPool.release(db);
  }
});
graph TB
subgraph "CI/CD Pipeline"
GH[GitHub Actions]
TEST[Automated Tests]
BUILD[Container Build]
SCAN[Security Scan]
PUSH[Registry Push]
end
subgraph "Kubernetes Cluster"
LB[Load Balancer]
POD1[MCP Pod 1]
POD2[MCP Pod 2]
POD3[MCP Pod 3]
HPA[Auto Scaler]
end
subgraph "Observability Stack"
OTEL[OpenTelemetry]
PROM[Prometheus]
GRAF[Grafana]
JAEG[Jaeger]
end
subgraph "Data Layer"
DB[(Database Pool)]
REDIS[(Redis Cache)]
end
GH --> TEST
TEST --> BUILD
BUILD --> SCAN
SCAN --> PUSH
PUSH --> LB
LB --> POD1
LB --> POD2
LB --> POD3
HPA --> POD1
HPA --> POD2
HPA --> POD3
POD1 --> OTEL
POD2 --> OTEL
POD3 --> OTEL
OTEL --> PROM
OTEL --> JAEG
PROM --> GRAF
JAEG --> GRAF
POD1 --> DB
POD2 --> DB
POD3 --> DB
POD1 --> REDIS
POD2 --> REDIS
POD3 --> REDISProduction Best Practices
Successful production deployments follow established patterns for reliability and maintainability. Implement circuit breakers for external service dependencies, use exponential backoff for retries, maintain comprehensive health check endpoints, and establish clear incident response procedures. Document runbooks for common operational scenarios and conduct regular disaster recovery drills.
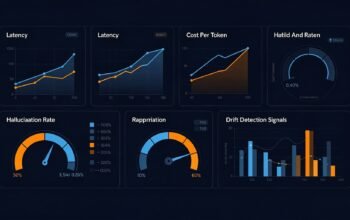
Monitor key performance indicators including request latency percentiles, error rates, resource utilization, and tool invocation patterns. Set up alerting thresholds that balance notification frequency with operational relevance, ensuring on-call teams receive actionable alerts rather than noise.
Conclusion
Production MCP deployments require systematic attention to infrastructure, automation, observability, and performance. This comprehensive guide has covered the MCP protocol from foundational concepts through production deployment, equipping you to build reliable, scalable AI integration layers. As MCP adoption grows across enterprise environments, these patterns provide the operational foundation for success.
References
- The New Stack – 15 Best Practices for Building MCP Servers in Production
- MCP Best Practices: Architecture & Implementation Guide
- SigNoz – MCP Observability with OpenTelemetry
- MCPcat – Monitor MCP Server Performance with OpenTelemetry
- Collabnix – How to Use MCP in Production: A Practical Guide
- Northflank – How to Build and Deploy an MCP Server
- GitHub Blog – A Practical Guide on How to Use the GitHub MCP Server
- Glama – Building AI CI/CD Pipelines with MCP
- Kubernetes Documentation – Deployments
- OpenTelemetry Documentation