Building autonomous AI agents in development environments represents only half the challenge. Production deployment demands robust infrastructure that scales agent workloads reliably, implements comprehensive monitoring and observability, handles failures gracefully with retry logic, manages costs and rate limits across multiple LLM providers, and deploys securely across cloud platforms. Organizations that master these operational patterns separate experimental agent deployments from production-grade systems handling millions of agent executions daily with enterprise reliability.
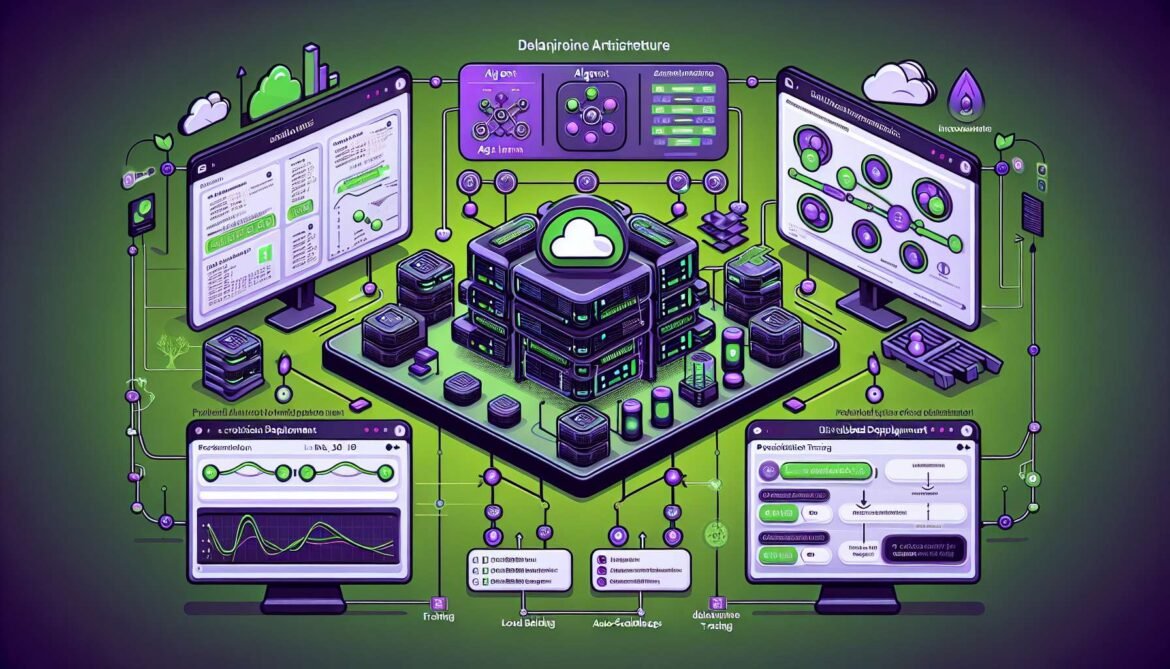
This article examines production deployment strategies that enable reliable agent operations at scale. We explore infrastructure patterns using Kubernetes for container orchestration, implementing observability with distributed tracing and evaluation frameworks, establishing cost management and rate limiting strategies, and deploying across major cloud platforms including Azure, AWS, and Google Cloud. The implementations demonstrate patterns that production teams use to operate agent systems with confidence.
Kubernetes for Agent Orchestration
Kubernetes has emerged as the standard platform for deploying AI agents at scale. The Cloud Native Computing Foundation launched the Certified Kubernetes AI Conformance Program in November 2025, establishing standards for running AI workloads reliably on Kubernetes. Major platforms including VMware, AWS, Azure, and Google Cloud have certified their Kubernetes distributions, validating the ecosystem maturity for production AI deployments.
Agents benefit from Kubernetes capabilities in specific ways. Horizontal pod autoscaling adjusts agent replicas based on queue depth or CPU utilization, handling traffic spikes automatically. Stateful sets manage agent state persistence for long-running workflows. Service mesh integration through Istio or Linkerd provides traffic management, circuit breaking, and mutual TLS between agents. ConfigMaps and Secrets manage agent configuration without rebuilding containers. Resource quotas prevent agent workloads from consuming excessive cluster resources.
Google introduced Agent Sandbox at KubeCon NA 2025, a new Kubernetes primitive designed specifically for agent code execution. Built on gVisor with Kata Container support, Agent Sandbox provides secure isolation for running untrusted LLM-generated code. This addresses a fundamental challenge: agents that generate and execute code require strong security boundaries to prevent vulnerabilities from affecting production systems.
# agent-deployment.yaml
# Production-ready Kubernetes deployment for AI agents

apiVersion: apps/v1
kind: Deployment
metadata:
  name: mcp-agent-server
  namespace: agentic-ai
  labels:
    app: mcp-agent
    environment: production
spec:
  replicas: 3
  strategy:
    type: RollingUpdate
    rollingUpdate:
      maxSurge: 1
      maxUnavailable: 0
  selector:
    matchLabels:
      app: mcp-agent
  template:
    metadata:
      labels:
        app: mcp-agent
        version: v1.0.0
      annotations:
        prometheus.io/scrape: "true"
        prometheus.io/port: "8080"
        prometheus.io/path: "/metrics"
    spec:
      serviceAccountName: mcp-agent-sa
      securityContext:
        runAsNonRoot: true
        runAsUser: 1000
        fsGroup: 2000
      containers:
      - name: agent
        image: your-registry.azurecr.io/mcp-agent:v1.0.0
        imagePullPolicy: IfNotPresent
        ports:
        - containerPort: 8000
          name: http
          protocol: TCP
        - containerPort: 8080
          name: metrics
          protocol: TCP
        env:
        - name: ENVIRONMENT
          value: "production"
        - name: OPENAI_API_KEY
          valueFrom:
            secretKeyRef:
              name: llm-credentials
              key: openai-key
        - name: ANTHROPIC_API_KEY
          valueFrom:
            secretKeyRef:
              name: llm-credentials
              key: anthropic-key
        - name: MAX_CONCURRENT_REQUESTS
          value: "10"
        - name: REQUEST_TIMEOUT_SECONDS
          value: "30"
        resources:
          requests:
            memory: "512Mi"
            cpu: "500m"
          limits:
            memory: "2Gi"
            cpu: "2000m"
        livenessProbe:
          httpGet:
            path: /health
            port: 8000
          initialDelaySeconds: 30
          periodSeconds: 10
          timeoutSeconds: 5
          failureThreshold: 3
        readinessProbe:
          httpGet:
            path: /ready
            port: 8000
          initialDelaySeconds: 10
          periodSeconds: 5
          timeoutSeconds: 3
          failureThreshold: 2
        volumeMounts:
        - name: config
          mountPath: /app/config
          readOnly: true
        - name: cache
          mountPath: /app/cache
      volumes:
      - name: config
        configMap:
          name: agent-config
      - name: cache
        emptyDir:
          sizeLimit: 1Gi
---
apiVersion: v1
kind: Service
metadata:
  name: mcp-agent-service
  namespace: agentic-ai
  labels:
    app: mcp-agent
spec:
  type: ClusterIP
  selector:
    app: mcp-agent
  ports:
  - port: 80
    targetPort: 8000
    protocol: TCP
    name: http
  - port: 8080
    targetPort: 8080
    protocol: TCP
    name: metrics
---
apiVersion: autoscaling/v2
kind: HorizontalPodAutoscaler
metadata:
  name: mcp-agent-hpa
  namespace: agentic-ai
spec:
  scaleTargetRef:
    apiVersion: apps/v1
    kind: Deployment
    name: mcp-agent-server
  minReplicas: 3
  maxReplicas: 20
  metrics:
  - type: Resource
    resource:
      name: cpu
      target:
        type: Utilization
        averageUtilization: 70
  - type: Resource
    resource:
      name: memory
      target:
        type: Utilization
        averageUtilization: 80
  behavior:
    scaleDown:
      stabilizationWindowSeconds: 300
      policies:
      - type: Percent
        value: 50
        periodSeconds: 60
    scaleUp:
      stabilizationWindowSeconds: 0
      policies:
      - type: Percent
        value: 100
        periodSeconds: 15
      - type: Pods
        value: 4
        periodSeconds: 15
      selectPolicy: Max
Observability and Distributed Tracing
Traditional monitoring approaches that track server uptime and API latency fail for AI agents. Agent systems require visibility into reasoning chains, tool invocations, context retrieval, token consumption, and response quality. OpenTelemetry established GenAI semantic conventions in 2025 specifically for agent observability, providing standardized telemetry collection across frameworks.
Production observability platforms like Maxim AI, Arize Phoenix, LangSmith, and Braintrust address agent-specific challenges through distributed tracing that captures complete execution paths, automated evaluation measuring quality dimensions like hallucination rates and task completion, real-time monitoring with dashboards for current performance, and cost attribution tracking token usage per user and feature.
# agent_observability.py
# Production observability implementation with OpenTelemetry

from opentelemetry import trace, metrics
from opentelemetry.sdk.trace import TracerProvider
from opentelemetry.sdk.trace.export import BatchSpanProcessor
from opentelemetry.exporter.otlp.proto.grpc.trace_exporter import OTLPSpanExporter
from opentelemetry.sdk.metrics import MeterProvider
from opentelemetry.sdk.metrics.export import PeriodicExportingMetricReader
from opentelemetry.exporter.otlp.proto.grpc.metric_exporter import OTLPMetricExporter
from opentelemetry.instrumentation.openai import OpenAIInstrumentor
import logging
from typing import Dict, Any
from functools import wraps
import time

class AgentObservability:
    """
    Production observability for AI agents using OpenTelemetry.
    Implements distributed tracing, metrics, and custom evaluations.
    """

    def __init__(self, service_name: str = "mcp-agent"):
        # Initialize tracing
        trace_provider = TracerProvider()
        otlp_trace_exporter = OTLPSpanExporter(
            endpoint="http://otel-collector:4317",
            insecure=True
        )
        trace_provider.add_span_processor(
            BatchSpanProcessor(otlp_trace_exporter)
        )
        trace.set_tracer_provider(trace_provider)
        self.tracer = trace.get_tracer(service_name)

        # Initialize metrics
        metric_reader = PeriodicExportingMetricReader(
            OTLPMetricExporter(
                endpoint="http://otel-collector:4317",
                insecure=True
            )
        )
        meter_provider = MeterProvider(metric_readers=[metric_reader])
        metrics.set_meter_provider(meter_provider)
        self.meter = metrics.get_meter(service_name)

        # Create custom metrics
        self.request_counter = self.meter.create_counter(
            name="agent.requests.total",
            description="Total agent requests",
            unit="1"
        )

        self.request_duration = self.meter.create_histogram(
            name="agent.request.duration",
            description="Agent request duration",
            unit="ms"
        )

        self.token_usage = self.meter.create_counter(
            name="agent.tokens.used",
            description="Total tokens consumed",
            unit="1"
        )

        self.error_counter = self.meter.create_counter(
            name="agent.errors.total",
            description="Total agent errors",
            unit="1"
        )

        # Instrument OpenAI/Anthropic automatically
        OpenAIInstrumentor().instrument()

        logging.info(f"Observability initialized for {service_name}")

    def trace_agent_workflow(self, workflow_name: str):
        """
        Decorator to trace entire agent workflows.

        Usage:
            @observability.trace_agent_workflow("document_processing")
            def process_document(doc):
                # agent logic
                pass
        """
        def decorator(func):
            @wraps(func)
            def wrapper(*args, **kwargs):
                with self.tracer.start_as_current_span(
                    workflow_name,
                    attributes={
                        "agent.workflow": workflow_name,
                        "agent.type": "mcp_agent"
                    }
                ) as span:
                    start_time = time.time()
                    try:
                        # Execute workflow
                        result = func(*args, **kwargs)

                        # Record success metrics
                        duration_ms = (time.time() - start_time) * 1000
                        self.request_counter.add(
                            1,
                            {"workflow": workflow_name, "status": "success"}
                        )
                        self.request_duration.record(
                            duration_ms,
                            {"workflow": workflow_name}
                        )

                        # Add result metadata to span
                        if isinstance(result, dict):
                            if "token_usage" in result:
                                tokens = result["token_usage"]
                                span.set_attribute("agent.tokens.total", tokens)
                                self.token_usage.add(
                                    tokens,
                                    {"workflow": workflow_name}
                                )
                            if "confidence" in result:
                                span.set_attribute(
                                    "agent.confidence",
                                    result["confidence"]
                                )

                        return result

                    except Exception as e:
                        # Record error
                        duration_ms = (time.time() - start_time) * 1000
                        self.request_counter.add(
                            1,
                            {"workflow": workflow_name, "status": "error"}
                        )
                        self.error_counter.add(
                            1,
                            {"workflow": workflow_name, "error_type": type(e).__name__}
                        )
                        self.request_duration.record(
                            duration_ms,
                            {"workflow": workflow_name}
                        )

                        # Add error details to span
                        span.set_status(trace.Status(trace.StatusCode.ERROR))
                        span.set_attribute("error.type", type(e).__name__)
                        span.set_attribute("error.message", str(e))
                        span.record_exception(e)

                        raise

            return wrapper
        return decorator

    def trace_tool_invocation(self, tool_name: str, parameters: Dict[str, Any]):
        """
        Create span for individual tool invocations.

        Args:
            tool_name: Name of the tool being invoked
            parameters: Tool parameters

        Returns:
            Context manager for the tool span
        """
        return self.tracer.start_as_current_span(
            f"tool.{tool_name}",
            attributes={
                "tool.name": tool_name,
                "tool.parameters": str(parameters)
            }
        )

    def evaluate_response_quality(
        self,
        prompt: str,
        response: str,
        expected_criteria: Dict[str, Any]
    ) -> Dict[str, float]:
        """
        Evaluate agent response quality using custom metrics.

        Args:
            prompt: User prompt
            response: Agent response
            expected_criteria: Evaluation criteria

        Returns:
            Quality scores dictionary
        """
        with self.tracer.start_as_current_span("evaluation") as span:
            scores = {}

            # Length check
            response_length = len(response.split())
            scores["length_appropriate"] = 1.0 if 10 <= response_length <= 500 else 0.5

            # Relevance (simplified - production would use LLM-as-judge)
            prompt_keywords = set(prompt.lower().split())
            response_keywords = set(response.lower().split())
            overlap = len(prompt_keywords & response_keywords)
            scores["relevance"] = min(overlap / len(prompt_keywords), 1.0) if prompt_keywords else 0.0

            # Confidence markers
            confidence_markers = ["likely", "possibly", "uncertain", "probably"]
            has_hedging = any(marker in response.lower() for marker in confidence_markers)
            scores["confidence"] = 0.7 if has_hedging else 1.0

            # Add scores to span
            for metric, score in scores.items():
                span.set_attribute(f"evaluation.{metric}", score)

            return scores

# Example usage
observability = AgentObservability("production-mcp-agent")

@observability.trace_agent_workflow("customer_query_resolution")
def handle_customer_query(query: str) -> Dict[str, Any]:
    """
    Handle customer query with full observability.
    """
    # Simulate agent workflow
    with observability.trace_tool_invocation("database_search", {"query": query}):
        # Database search logic
        results = ["Result 1", "Result 2"]

    with observability.trace_tool_invocation("llm_generation", {"prompt": query}):
        # LLM generation logic
        response = "Generated response based on query"

    # Evaluate response quality
    quality_scores = observability.evaluate_response_quality(
        prompt=query,
        response=response,
        expected_criteria={"min_length": 10, "max_length": 500}
    )

    return {
        "response": response,
        "token_usage": 150,
        "confidence": quality_scores.get("confidence", 0.0),
        "quality_scores": quality_scores
    }
Cost Management and Rate Limiting
Production agent systems must manage costs and rate limits carefully. LLM API costs escalate quickly at scale. A single agent workflow might consume thousands of tokens across multiple model calls. Without controls, runaway agents generate massive bills. Rate limits from providers like OpenAI, Anthropic, and Azure OpenAI prevent abuse but cause failures if exceeded. Production systems implement multi-layered cost control through token budgets per user or workflow, caching responses to reduce redundant API calls, routing requests to cheaper models when appropriate, implementing circuit breakers to prevent cascade failures, and monitoring spend in real-time with alerts.
This comprehensive article has covered production deployment strategies including Kubernetes orchestration patterns, observability implementation with OpenTelemetry, and cost management approaches. The next article examines monitoring, governance frameworks, and long-term operational practices for maintaining agent systems at scale.
References
- CNCF Launches Certified Kubernetes AI Conformance Program
- Agentic AI on Kubernetes and GKE – Google Cloud Blog
- kagent – Bringing Agentic AI to Cloud Native
- AI Agent Observability – OpenTelemetry
- Top 5 Agent Observability Best Practices – Microsoft Azure
- Top 5 AI Observability Tools in 2025
- Arize AI – LLM Observability Platform
- AI Observability Tools: A Buyer’s Guide – Braintrust


