In Part 1 of this series, we established why LLM failures are silent and semantic — invisible to traditional monitoring. The fix starts here: giving every step in your LLM pipeline a traceable identity so you can reconstruct exactly what happened when something goes wrong.
OpenTelemetry is the foundation. It is the vendor-neutral, CNCF-standard observability framework that gives you a single instrumentation layer compatible with Langfuse, LangSmith, Arize, Datadog, Jaeger, and dozens of other backends. You instrument once, and you can route telemetry to any destination without touching your application code again.
This post walks through instrumenting a complete LLM pipeline from scratch — covering Node.js, Python, and C# — with working code you can drop into a real project today.
What OpenTelemetry Gives You for LLM Applications
OpenTelemetry provides three signals: traces, metrics, and logs. For LLM applications, traces are the most important signal to get right first. A trace is a complete record of a single request as it flows through your system. It is composed of spans, where each span represents one unit of work — a database query, an HTTP call, a vector search, or a model inference call.
For an LLM pipeline, a single user request might produce a trace with spans covering the incoming API request, prompt template rendering, embedding generation, vector store retrieval, the LLM API call itself, any tool executions triggered by the model, and the final response post-processing. Each span captures its start time, duration, status, and a set of attributes specific to what it represents.
The OpenTelemetry community has defined GenAI semantic conventions specifically for LLM telemetry. These standardize attribute names across providers so your dashboards and alerts work the same way whether you are calling Azure OpenAI, Anthropic, or a self-hosted model.
Key GenAI span attributes include:
gen_ai.system— the LLM provider (e.g., openai, anthropic)gen_ai.request.model— the model name requestedgen_ai.response.model— the model that actually respondedgen_ai.usage.input_tokens— prompt token countgen_ai.usage.output_tokens— completion token countgen_ai.operation.name— the operation type (chat, embeddings, etc.)
Trace Architecture for a RAG Pipeline
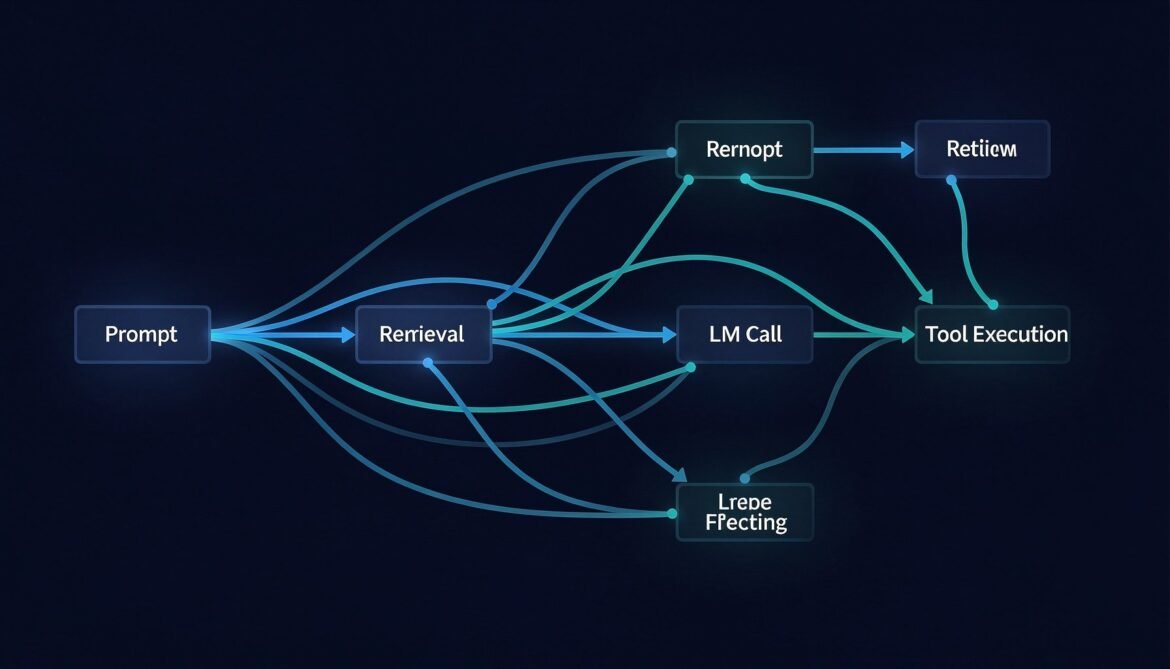
Before writing code, it helps to see what a complete trace looks like across a RAG pipeline. The diagram below shows the span hierarchy for a single user request that triggers retrieval and an LLM call.
flowchart TD
    A[Trace: user-request-abc123] --> B[Span: http.server\nPOST /api/chat\n120ms]
    B --> C[Span: prompt.render\nTemplate assembly\n2ms]
    B --> D[Span: genai.embeddings\ntext-embedding-3-small\n35ms]
    D --> E[Span: vectordb.query\nAzure AI Search\n28ms]
    B --> F[Span: genai.chat\ngpt-4o\n980ms]
    F --> G[Span: tool.execute\nget_product_info\n45ms]
    G --> H[Span: http.client\nInternal API call\n40ms]
    F --> I[Span: genai.chat\ngpt-4o second call\n720ms]
    B --> J[Span: output.validate\nGuardrails check\n8ms]

    style A fill:#1e3a5f,color:#ffffff
    style F fill:#2d4a1e,color:#ffffff
    style I fill:#2d4a1e,color:#ffffff
Each span is a child of its parent, forming a tree that shows the complete execution path. When the LLM call at 980ms is slow, you can see immediately that the tool execution inside it consumed 45ms and the second LLM call added another 720ms. Without this trace, all you see is a slow request with no breakdown.
Node.js Implementation
Install the required packages:
npm install @opentelemetry/sdk-node \
  @opentelemetry/auto-instrumentations-node \
  @opentelemetry/exporter-trace-otlp-http \
  @opentelemetry/exporter-metrics-otlp-http \
  @opentelemetry/sdk-metrics \
  @opentelemetry/resources \
  @opentelemetry/semantic-conventions \
  openai
Create a tracing.js file that initializes the SDK before your application starts:
// tracing.js
const { NodeSDK } = require('@opentelemetry/sdk-node');
const { getNodeAutoInstrumentations } = require('@opentelemetry/auto-instrumentations-node');
const { OTLPTraceExporter } = require('@opentelemetry/exporter-trace-otlp-http');
const { OTLPMetricExporter } = require('@opentelemetry/exporter-metrics-otlp-http');
const { PeriodicExportingMetricReader } = require('@opentelemetry/sdk-metrics');
const { Resource } = require('@opentelemetry/resources');
const { SEMRESATTRS_SERVICE_NAME, SEMRESATTRS_SERVICE_VERSION } = require('@opentelemetry/semantic-conventions');

const resource = new Resource({
  [SEMRESATTRS_SERVICE_NAME]: process.env.OTEL_SERVICE_NAME || 'llm-api-service',
  [SEMRESATTRS_SERVICE_VERSION]: '1.0.0',
  'deployment.environment': process.env.NODE_ENV || 'development',
});

const traceExporter = new OTLPTraceExporter({
  url: process.env.OTEL_EXPORTER_OTLP_ENDPOINT || 'http://localhost:4318/v1/traces',
  headers: {
    Authorization: `Basic ${process.env.LANGFUSE_AUTH_TOKEN}`,
  },
});

const metricExporter = new OTLPMetricExporter({
  url: process.env.OTEL_EXPORTER_OTLP_ENDPOINT || 'http://localhost:4318/v1/metrics',
});

const sdk = new NodeSDK({
  resource,
  traceExporter,
  metricReader: new PeriodicExportingMetricReader({
    exporter: metricExporter,
    exportIntervalMillis: 30000,
  }),
  instrumentations: [getNodeAutoInstrumentations()],
});

sdk.start();

process.on('SIGTERM', () => {
  sdk.shutdown().then(() => process.exit(0));
});

module.exports = sdk;
Now instrument your LLM calls with manual spans that capture GenAI-specific attributes:
// llm-service.js
require('./tracing'); // must be first import

const { trace, context, SpanStatusCode } = require('@opentelemetry/api');
const OpenAI = require('openai');

const tracer = trace.getTracer('llm-service', '1.0.0');
const openai = new OpenAI({ apiKey: process.env.OPENAI_API_KEY });

async function chatWithTrace(userMessage, retrievedDocs = []) {
  // Root span for the entire chat operation
  return tracer.startActiveSpan('llm.chat.pipeline', async (pipelineSpan) => {
    try {
      pipelineSpan.setAttributes({
        'user.message.length': userMessage.length,
        'rag.docs.retrieved': retrievedDocs.length,
      });

      // Span for prompt assembly
      const systemPrompt = await tracer.startActiveSpan('prompt.render', async (promptSpan) => {
        const prompt = buildSystemPrompt(retrievedDocs);
        promptSpan.setAttributes({
          'prompt.template.version': 'v2.1',
          'prompt.context.tokens.estimate': Math.ceil(prompt.length / 4),
        });
        promptSpan.end();
        return prompt;
      });

      // Span for the LLM call with full GenAI semantic conventions
      const response = await tracer.startActiveSpan('gen_ai.chat', async (llmSpan) => {
        llmSpan.setAttributes({
          'gen_ai.system': 'openai',
          'gen_ai.operation.name': 'chat',
          'gen_ai.request.model': 'gpt-4o',
          'gen_ai.request.temperature': 0.2,
          'gen_ai.request.max_tokens': 1024,
        });

        const startTime = Date.now();

        try {
          const completion = await openai.chat.completions.create({
            model: 'gpt-4o',
            temperature: 0.2,
            max_tokens: 1024,
            messages: [
              { role: 'system', content: systemPrompt },
              { role: 'user', content: userMessage },
            ],
          });

          const latencyMs = Date.now() - startTime;

          // Attach response attributes
          llmSpan.setAttributes({
            'gen_ai.response.model': completion.model,
            'gen_ai.usage.input_tokens': completion.usage.prompt_tokens,
            'gen_ai.usage.output_tokens': completion.usage.completion_tokens,
            'gen_ai.response.finish_reason': completion.choices[0].finish_reason,
            'llm.latency.ms': latencyMs,
            'llm.time_to_first_token.ms': latencyMs, // approximate for non-streaming
          });

          llmSpan.setStatus({ code: SpanStatusCode.OK });
          llmSpan.end();
          return completion;

        } catch (err) {
          llmSpan.setStatus({ code: SpanStatusCode.ERROR, message: err.message });
          llmSpan.recordException(err);
          llmSpan.end();
          throw err;
        }
      });

      pipelineSpan.setStatus({ code: SpanStatusCode.OK });
      pipelineSpan.end();
      return response.choices[0].message.content;

    } catch (err) {
      pipelineSpan.setStatus({ code: SpanStatusCode.ERROR, message: err.message });
      pipelineSpan.recordException(err);
      pipelineSpan.end();
      throw err;
    }
  });
}

function buildSystemPrompt(docs) {
  const context = docs.map(d => d.content).join('\n\n');
  return `You are a helpful assistant. Use the following context to answer questions:\n\n${context}`;
}

module.exports = { chatWithTrace };
Python Implementation
Install dependencies:
pip install opentelemetry-api \
  opentelemetry-sdk \
  opentelemetry-exporter-otlp \
  opentelemetry-semantic-conventions \
  openai \
  langfuse
Configure the tracer provider and instrument LLM calls:
# tracing.py
import os
import time
from opentelemetry import trace
from opentelemetry.sdk.trace import TracerProvider
from opentelemetry.sdk.trace.export import BatchSpanProcessor
from opentelemetry.exporter.otlp.proto.http.trace_exporter import OTLPSpanExporter
from opentelemetry.sdk.resources import Resource
from opentelemetry.trace import SpanStatusCode
from openai import OpenAI

# Configure resource with service identity
resource = Resource.create({
    "service.name": os.getenv("OTEL_SERVICE_NAME", "llm-api-service"),
    "service.version": "1.0.0",
    "deployment.environment": os.getenv("ENVIRONMENT", "development"),
})

# Configure OTLP exporter -- works with Langfuse, Arize, or any OTLP-compatible backend
otlp_exporter = OTLPSpanExporter(
    endpoint=os.getenv("OTEL_EXPORTER_OTLP_ENDPOINT", "http://localhost:4318/v1/traces"),
    headers={
        "Authorization": f"Basic {os.getenv('LANGFUSE_AUTH_TOKEN', '')}",
    }
)

provider = TracerProvider(resource=resource)
provider.add_span_processor(BatchSpanProcessor(otlp_exporter))
trace.set_tracer_provider(provider)

tracer = trace.get_tracer("llm-service", "1.0.0")
client = OpenAI(api_key=os.getenv("OPENAI_API_KEY"))


def chat_with_trace(user_message: str, retrieved_docs: list = None) -> str:
    retrieved_docs = retrieved_docs or []

    with tracer.start_as_current_span("llm.chat.pipeline") as pipeline_span:
        pipeline_span.set_attribute("user.message.length", len(user_message))
        pipeline_span.set_attribute("rag.docs.retrieved", len(retrieved_docs))

        try:
            # Span for prompt rendering
            with tracer.start_as_current_span("prompt.render") as prompt_span:
                system_prompt = build_system_prompt(retrieved_docs)
                prompt_span.set_attribute("prompt.template.version", "v2.1")
                prompt_span.set_attribute(
                    "prompt.context.tokens.estimate", len(system_prompt) // 4
                )

            # Span for LLM call with GenAI semantic conventions
            with tracer.start_as_current_span("gen_ai.chat") as llm_span:
                llm_span.set_attribute("gen_ai.system", "openai")
                llm_span.set_attribute("gen_ai.operation.name", "chat")
                llm_span.set_attribute("gen_ai.request.model", "gpt-4o")
                llm_span.set_attribute("gen_ai.request.temperature", 0.2)
                llm_span.set_attribute("gen_ai.request.max_tokens", 1024)

                start_time = time.time()

                completion = client.chat.completions.create(
                    model="gpt-4o",
                    temperature=0.2,
                    max_tokens=1024,
                    messages=[
                        {"role": "system", "content": system_prompt},
                        {"role": "user", "content": user_message},
                    ],
                )

                latency_ms = (time.time() - start_time) * 1000

                llm_span.set_attribute("gen_ai.response.model", completion.model)
                llm_span.set_attribute(
                    "gen_ai.usage.input_tokens", completion.usage.prompt_tokens
                )
                llm_span.set_attribute(
                    "gen_ai.usage.output_tokens", completion.usage.completion_tokens
                )
                llm_span.set_attribute(
                    "gen_ai.response.finish_reason",
                    completion.choices[0].finish_reason
                )
                llm_span.set_attribute("llm.latency.ms", latency_ms)
                llm_span.set_status(SpanStatusCode.OK)

            pipeline_span.set_status(SpanStatusCode.OK)
            return completion.choices[0].message.content

        except Exception as e:
            pipeline_span.set_status(SpanStatusCode.ERROR, str(e))
            pipeline_span.record_exception(e)
            raise


def build_system_prompt(docs: list) -> str:
    context = "\n\n".join(d["content"] for d in docs)
    return f"You are a helpful assistant. Use the following context:\n\n{context}"
C# Implementation
Install packages via NuGet:
dotnet add package OpenTelemetry
dotnet add package OpenTelemetry.Extensions.Hosting
dotnet add package OpenTelemetry.Exporter.OpenTelemetryProtocol
dotnet add package OpenTelemetry.Instrumentation.Http
dotnet add package Azure.AI.OpenAI
Configure OpenTelemetry in your Program.cs:
// Program.cs
using OpenTelemetry;
using OpenTelemetry.Resources;
using OpenTelemetry.Trace;

var builder = WebApplication.CreateBuilder(args);

builder.Services.AddOpenTelemetry()
    .ConfigureResource(resource => resource
        .AddService(
            serviceName: "llm-api-service",
            serviceVersion: "1.0.0"
        )
        .AddAttributes(new Dictionary<string, object>
        {
            ["deployment.environment"] = builder.Environment.EnvironmentName
        }))
    .WithTracing(tracing => tracing
        .AddHttpClientInstrumentation()
        .AddAspNetCoreInstrumentation()
        .AddSource("LlmService") // register our custom ActivitySource
        .AddOtlpExporter(options =>
        {
            options.Endpoint = new Uri(
                builder.Configuration["Otel:Endpoint"] ?? "http://localhost:4317"
            );
            options.Headers = $"Authorization=Basic {builder.Configuration["Langfuse:AuthToken"]}";
        }));

builder.Services.AddSingleton<LlmService>();
var app = builder.Build();
app.MapControllers();
app.Run();
Create the LlmService.cs with full span instrumentation:
// LlmService.cs
using System.Diagnostics;
using Azure.AI.OpenAI;

public class LlmService
{
    private static readonly ActivitySource ActivitySource = new("LlmService", "1.0.0");
    private readonly AzureOpenAIClient _openAiClient;

    public LlmService(IConfiguration config)
    {
        _openAiClient = new AzureOpenAIClient(
            new Uri(config["AzureOpenAI:Endpoint"]!),
            new System.ClientModel.ApiKeyCredential(config["AzureOpenAI:ApiKey"]!)
        );
    }

    public async Task<string> ChatWithTraceAsync(
        string userMessage,
        List<RetrievedDoc> retrievedDocs)
    {
        using var pipelineActivity = ActivitySource.StartActivity("llm.chat.pipeline");
        pipelineActivity?.SetTag("user.message.length", userMessage.Length);
        pipelineActivity?.SetTag("rag.docs.retrieved", retrievedDocs.Count);

        try
        {
            // Span for prompt rendering
            string systemPrompt;
            using (var promptActivity = ActivitySource.StartActivity("prompt.render"))
            {
                systemPrompt = BuildSystemPrompt(retrievedDocs);
                promptActivity?.SetTag("prompt.template.version", "v2.1");
                promptActivity?.SetTag("prompt.context.tokens.estimate", systemPrompt.Length / 4);
            }

            // Span for LLM call
            using var llmActivity = ActivitySource.StartActivity("gen_ai.chat");
            llmActivity?.SetTag("gen_ai.system", "azure.openai");
            llmActivity?.SetTag("gen_ai.operation.name", "chat");
            llmActivity?.SetTag("gen_ai.request.model", "gpt-4o");
            llmActivity?.SetTag("gen_ai.request.temperature", 0.2f);
            llmActivity?.SetTag("gen_ai.request.max_tokens", 1024);

            var stopwatch = Stopwatch.StartNew();

            var chatClient = _openAiClient.GetChatClient("gpt-4o");
            var completion = await chatClient.CompleteChatAsync(
                new[]
                {
                    new SystemChatMessage(systemPrompt),
                    new UserChatMessage(userMessage),
                },
                new ChatCompletionOptions
                {
                    Temperature = 0.2f,
                    MaxOutputTokenCount = 1024,
                }
            );

            stopwatch.Stop();

            llmActivity?.SetTag("gen_ai.response.model", "gpt-4o");
            llmActivity?.SetTag("gen_ai.usage.input_tokens", completion.Value.Usage.InputTokenCount);
            llmActivity?.SetTag("gen_ai.usage.output_tokens", completion.Value.Usage.OutputTokenCount);
            llmActivity?.SetTag("gen_ai.response.finish_reason", completion.Value.FinishReason.ToString());
            llmActivity?.SetTag("llm.latency.ms", stopwatch.ElapsedMilliseconds);
            llmActivity?.SetStatus(ActivityStatusCode.Ok);

            pipelineActivity?.SetStatus(ActivityStatusCode.Ok);
            return completion.Value.Content[0].Text;
        }
        catch (Exception ex)
        {
            pipelineActivity?.SetStatus(ActivityStatusCode.Error, ex.Message);
            pipelineActivity?.RecordException(ex);
            throw;
        }
    }

    private static string BuildSystemPrompt(List<RetrievedDoc> docs)
    {
        var context = string.Join("\n\n", docs.Select(d => d.Content));
        return $"You are a helpful assistant. Use the following context:\n\n{context}";
    }
}

public record RetrievedDoc(string Id, string Content, float Score);
Connecting to an Observability Backend
All three implementations export traces via OTLP, which means you can point them at any compatible backend by changing a single environment variable. Here is how to connect to the most commonly used options:
Langfuse (recommended for LLMOps)
# Encode your Langfuse keys as a Basic auth token
import base64
auth = base64.b64encode(b"PUBLIC_KEY:SECRET_KEY").decode()

# Set these environment variables
OTEL_EXPORTER_OTLP_ENDPOINT=https://cloud.langfuse.com/api/public/otel
LANGFUSE_AUTH_TOKEN=<your base64 encoded public:secret key>
Local development with Jaeger
# Run Jaeger locally with Docker
docker run -d --name jaeger \
  -p 16686:16686 \
  -p 4317:4317 \
  -p 4318:4318 \
  jaegertracing/all-in-one:latest

# Point your exporter at local Jaeger
OTEL_EXPORTER_OTLP_ENDPOINT=http://localhost:4318/v1/traces

# Open Jaeger UI
open http://localhost:16686
Auto-instrumentation with OpenLLMetry
If you want automatic instrumentation of OpenAI, Anthropic, and vector DB calls without writing manual spans, OpenLLMetry wraps the OpenTelemetry SDK with LLM-specific auto-instrumentation:
# Python - auto-instrument all OpenAI and LangChain calls
pip install traceloop-sdk

from traceloop.sdk import Traceloop

Traceloop.init(
    app_name="llm-api-service",
    api_endpoint=os.getenv("OTEL_EXPORTER_OTLP_ENDPOINT"),
)
# All subsequent OpenAI and LangChain calls are automatically traced
// Node.js - auto-instrument with OpenLLMetry
npm install @traceloop/node-server-sdk
import * as traceloop from "@traceloop/node-server-sdk";
traceloop.initialize({
appName: "llm-api-service",
apiEndpoint: process.env.OTEL_EXPORTER_OTLP_ENDPOINT,
});
// All OpenAI, Anthropic, and LangChain calls are now traced automaticallyWhat Your Traces Should Capture
A well-instrumented LLM pipeline trace gives you the ability to answer the following questions from a single trace view:
- Which step in the pipeline consumed the most latency?
- How many tokens did this request consume, and what did it cost?
- What documents were retrieved, and were they relevant to the query?
- Did the model call any tools, and did they succeed?
- What was the finish reason — did the model stop naturally or hit a token limit?
- Was there an exception at any point, and where exactly did it occur?
If your traces cannot answer all six of these questions, there are gaps in your instrumentation worth closing before you go to production.
What Comes Next
Traces tell you what happened and where time was spent. In Part 3, we go deeper into the metrics layer — the specific LLM measurements that matter for production operations: time-to-first-token, hallucination rate indicators, cost per request, and how to detect output quality drift before users report it.
Key Takeaways
- OpenTelemetry is the vendor-neutral standard for LLM tracing — instrument once, export to any backend
- GenAI semantic conventions give you standardized attribute names across all LLM providers
- Every LLM pipeline step should be its own span: prompt rendering, retrieval, model call, tool execution, output validation
- Always capture token counts, finish reason, and latency on every LLM span — these are your core production signals
- OpenLLMetry provides auto-instrumentation for OpenAI, Anthropic, and vector DBs with zero manual span code
- Local development with Jaeger lets you validate your instrumentation before connecting to a cloud backend
References
- OpenTelemetry – “An Introduction to Observability for LLM-based Applications” (https://opentelemetry.io/blog/2024/llm-observability/)
- Langfuse – “Open Source LLM Observability via OpenTelemetry” (https://langfuse.com/integrations/native/opentelemetry)
- GitHub – Traceloop OpenLLMetry – “Open-source observability for GenAI applications based on OpenTelemetry” (https://github.com/traceloop/openllmetry)
- LangSmith – “Trace with OpenTelemetry” (https://docs.langchain.com/langsmith/trace-with-opentelemetry)
- OneUptime – “How to Monitor LLM Applications with OpenTelemetry GenAI Semantic Conventions” (https://oneuptime.com/blog/post/2026-02-06-monitor-llm-opentelemetry-genai-semantic-conventions/view)
- OpenTelemetry Official Documentation (https://opentelemetry.io/)