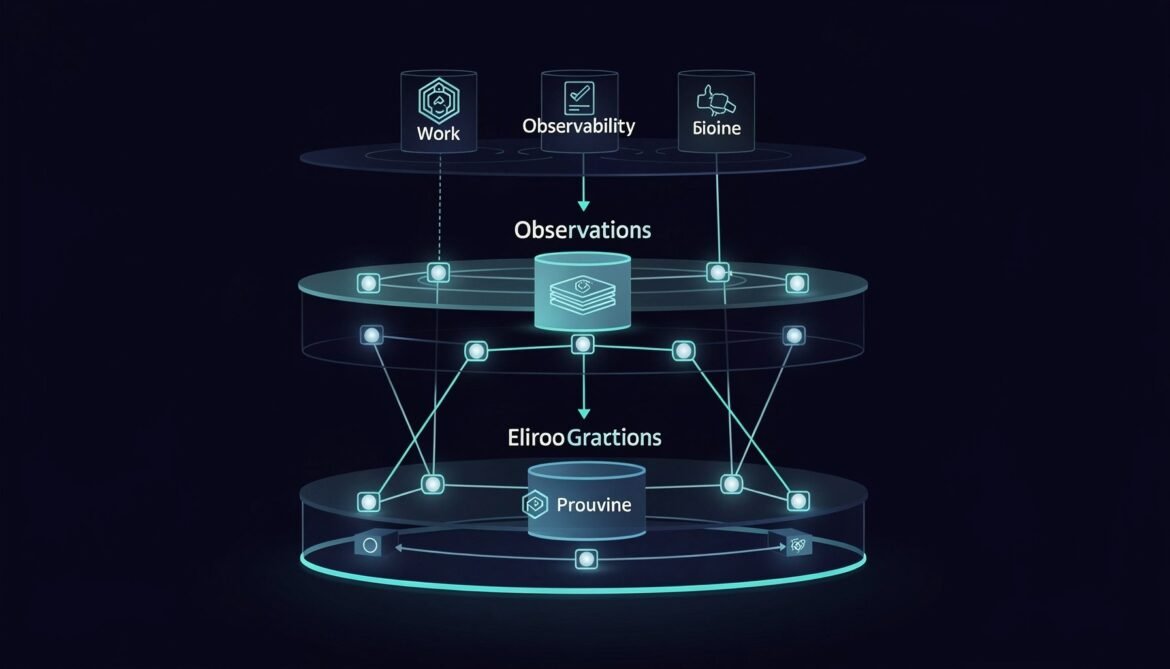
Seven posts, seven production systems. This final installment assembles every piece — distributed tracing, metrics, evaluation, prompt versioning, RAG observability, and cost governance — into one reference architecture with a phased implementation checklist you can start using this week.
Tag: grafana
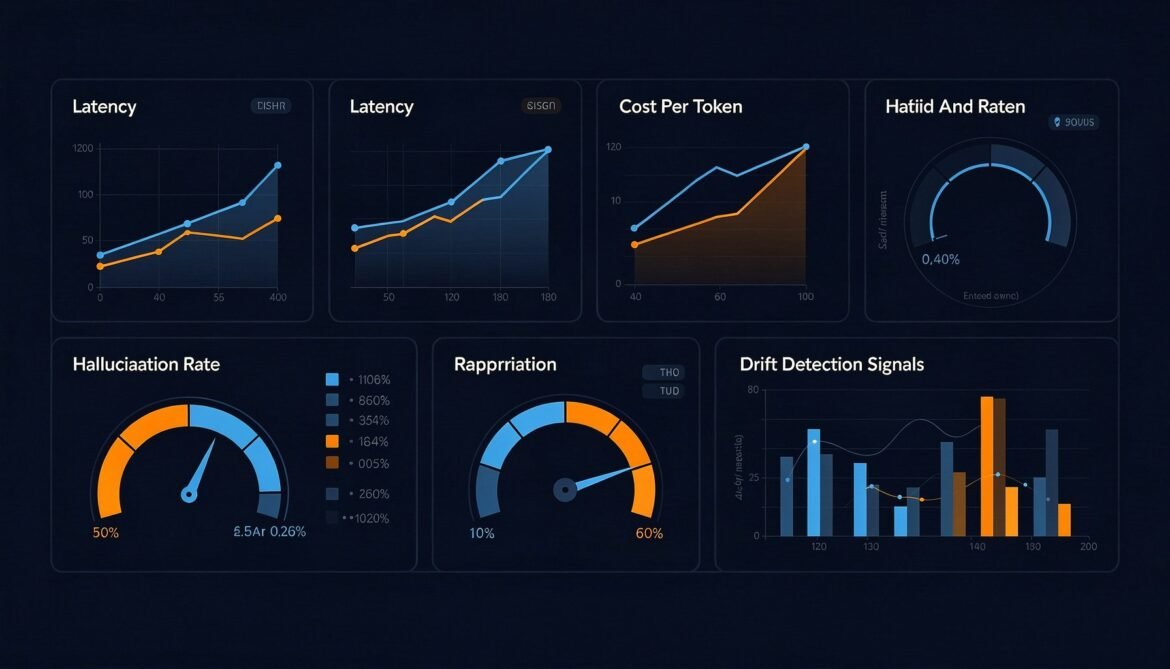
LLM Metrics That Actually Matter: Latency, Cost, Hallucination Rate, and Drift
Uptime and error rate are not enough. This post covers the metrics that actually reveal whether your LLM is working correctly in production — time-to-first-token, cost per request, hallucination rate indicators, output drift, and how to build dashboards that catch silent failures before users do.
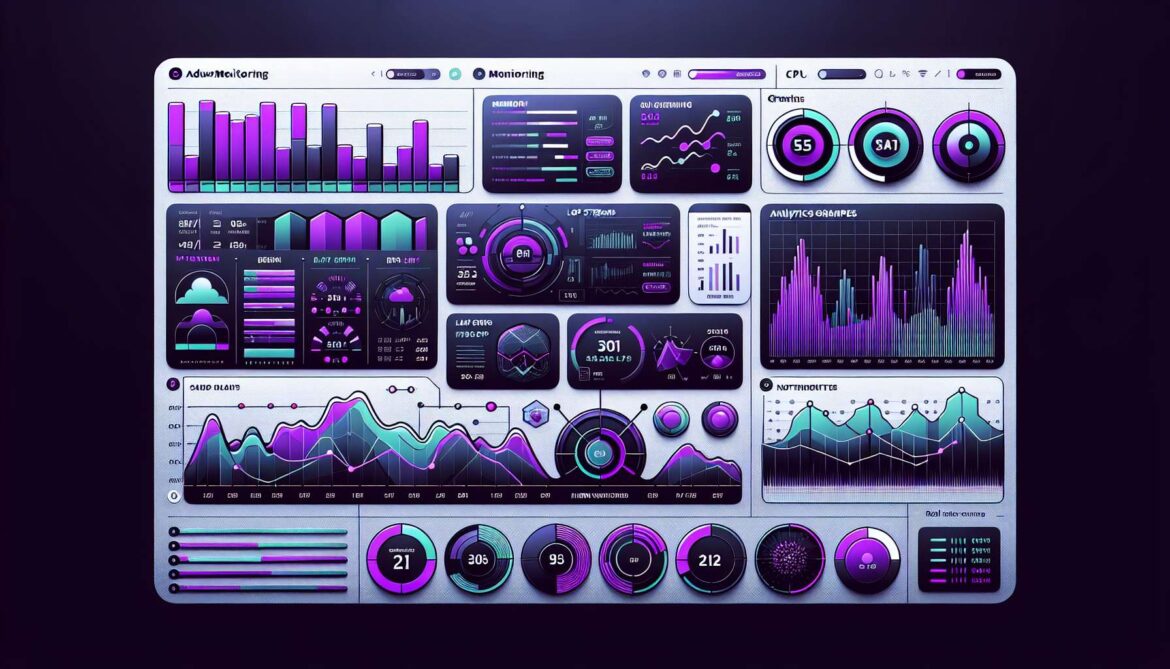
Advanced PM2 Monitoring, Logging, and Alerting Systems
Master advanced PM2 monitoring with PM2 Plus, Prometheus integration, centralized logging, and custom alerting systems. Build comprehensive dashboards for production monitoring.
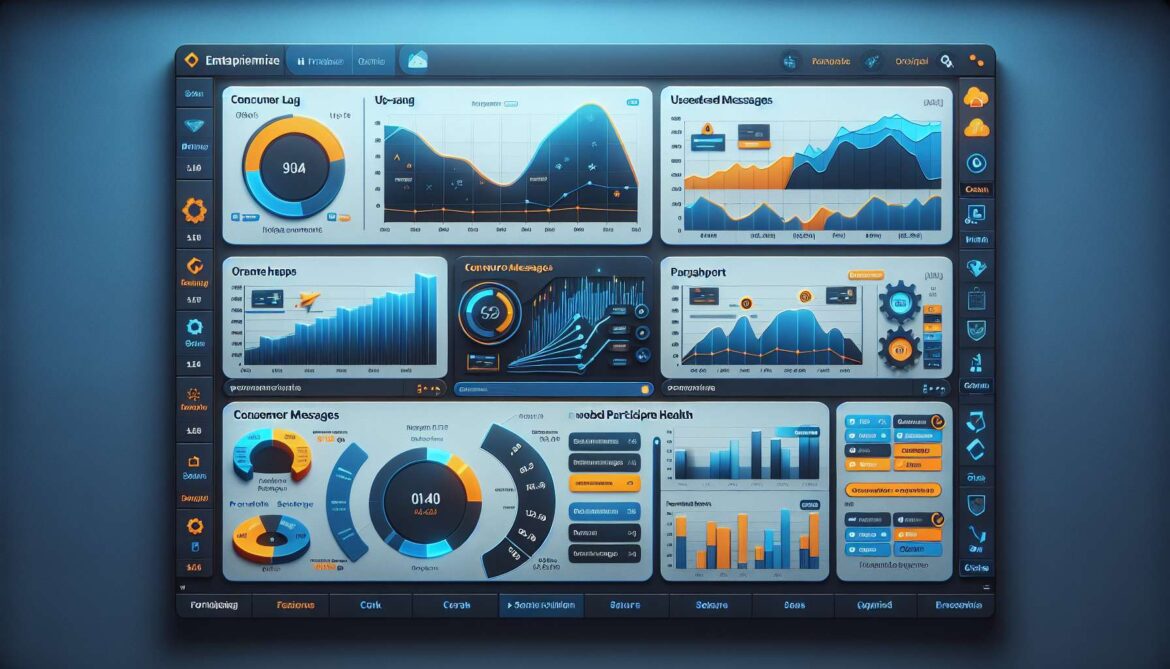
Advanced Kafka Message Monitoring: Enterprise Solutions with Prometheus and Grafana
Continuing from our previous guide on identifying unused messages in Kafka, this article focuses on advanced monitoring techniques, automated alerting systems, and C# implementations for


